A wobble on Friday turned into a full on panic on Monday as global equity indexes plunged. The worst of it was seen in Japan as its Topix index fell by 12%. The US markets then opened and followed suit—although they did not quite match the alarm in Asia—seeing the S&P 500 register a 3.0% decline.
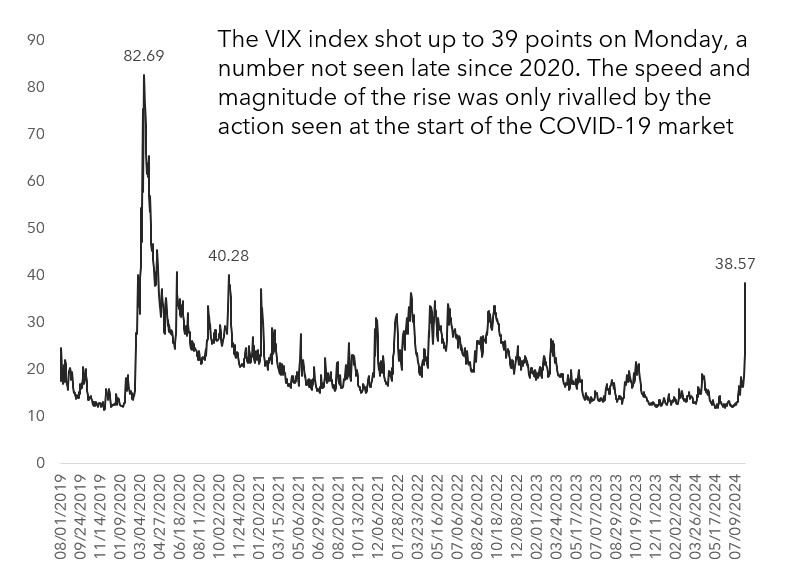
The Cboe Volatility Index® (VIX® Index), one of the most recognized measures of anticipated volatility (better understood in this context as fear) rocketed from 23 points at the end of day on Friday—which was already as high as it had been since March 2024—to hit 39 by the close of business on Monday, which is a number that has not been hit since 2020 and the COVID-19 pandemic.
Monday’s action did not come as a bolt from the blue. As said previously, there was a wobble on Friday, and in truth indexes across the world had been descending, albeit at a more restrained pace, from the peaks they hit in July. The US Nasdaq hit 18,647 on 10 July, 2024. It hit 16,200 at the close on Monday, but only 3.1% of the decline from the peak occurred on that day. The S&P 500 peaked on 16 July, 2024 and its a similar story there. yes, Monday was a standout day in terms of historical daily moves, but the index had handed back 5.5% of the peak up to that point. The same story is repeated with the Topix which peaked on 11 July, 2024.
Stock market tipping point
Monday, or rather Friday was an inflection point. But whatever was worrying investors was worrying some of them at least since mid-July. What happened on Friday was a the publication of a US job report. A lot fewer jobs were added then expected and more peple were unemployed. This brought other recent bits of economic data in to focus. Things like manufacturing reports from the US, but also European countries had been not as encouraging as hoped for some time.
Interest rates have been raised across the globe to tame inflation that had emerged after lockdowns ended, demand went up, and supply chains creaked under the pressure. To that inflationary mix you can add the effect of conflict in the Middle East and Eastern Europe. The worry with higher rates is that they will go to far and tip an economy into recession before central bankers are satisfied that inflation is under control. The US Central Bank had decided to hold interest rates at a 5.25% to 5.50% in the middle of last week, as markets expected. But by Friday, investors had decided that they had held them to high for to long, making a recession likely, and they had a meltdown. Fears in the US were replicated across the world in economies that had high rates and not stellar economic data, and of course some that did not, such is the interconnected nature of the markets.
Flight to safety
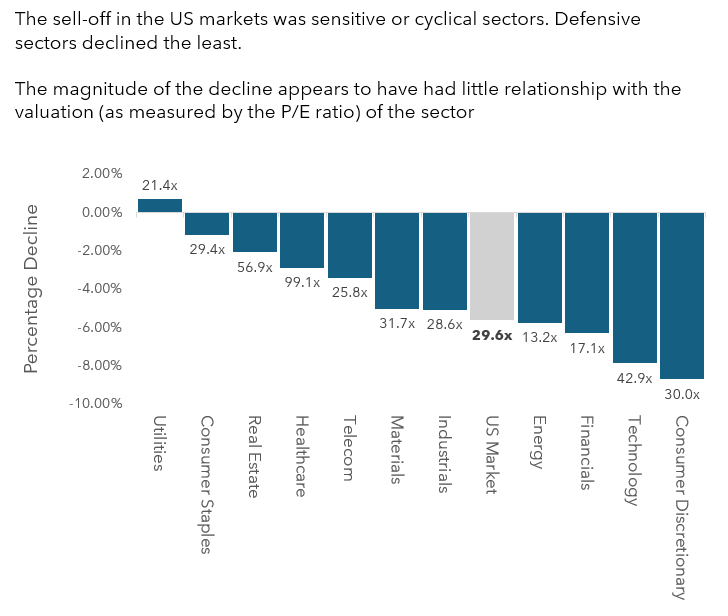
When investors panic over things like looming recessions that might transpire to be real or imagined, they pull money out of the riskier parts of the markets, like equities, hence the decline in stock markets. But not all sectors bore the brunt equally. In the US sensitive and cyclical sectors like Technology, Financials and Industrials declined the most whilst defensive sectors like Utilities and consumer staples declined the least. The magnitude of the sector wise decline bore no relationship to the valuation of the sector as measured by the P/E ratio, so I am unwilling to lay the blame at the door of what some might call too richly priced tech stocks.
A similar sector wise pattern emerged in the UK market’s. The same was true for Japan, albeit with larger percentage declines across the board. The spread between US corporate bonds and government ones widened. This indicates at least a realisation of risk that businesses might not be good for their debt if a recession occurs. This all reeks of a flight-to-safety. Note that as bond prices rise the yield on them falls, so that corporate spread rise can reflect selling of bonds. Then we have the fall in equity markets, dominated by prices of risker sectors falling more than “safer” ones stacked with companies that tend to hold up better when investors cut back on their spending.
However, in a typical flight to safety, the risky stuff falls in price and the safer stuff rises, as investors sell the former and pile into the later. The yields on government bonds were either flat or down a bit, which is not typical of the big spikes seen in a flight to safety, and might reflect the increased probability of a rate cut rather than a glut of frightened investor money pouring into bills and bonds, which would happen if a recession materialised.
The Japan carry trade
Japan was notable. It suffered the worst on Monday despite the precipitating data coming out of the US. The line is that it was in part due to the unwinding of the carry-trade which set off the turmoil in the land of the rising sun. If you are a wealthy and connected US individual or more likely a firm, you can borrow Japanese Yen at a very low cost, since Japan’s central bank has kept rates at zero or below for an age. You sell the Yen and buy US dollars, for example, and then use those dollars to buy US bonds and stocks whose rate of returns will hopefully be higher than near zero. That way you are using borrowed money to buy assets that will return enough to pay of the interest on the yen loan and then some
When the US has been raising rates that were already higher than the one set by the Bank of Japan (BOJ) its almost money for nothing. But what happens when the Bank of Japan starts to raise rates, as it did last week. What then if week US data makes investors start pricing in a US rate cut? That carry trade starts to look a lot less unattractive, and possibly starts to look like a losing one. Investors will start to unwind the trade when that happens.
The carry trade, since it involves selling Yen and buying US Dollars, also has the effect of making the Yen cheaper and the Dollar relatively more expensive when it is in play. However, when it starts to unwind the reverse happens. A five-year chart of the amount of US Dollars one Yen buys shows goes broadly from top left to bottom right. This means one Yen buys fewer and fewer dollars over time, which is what would be expected.
One Japanese yen has bought fewer and fewer dollars over time, until recently when the trend has reversed.
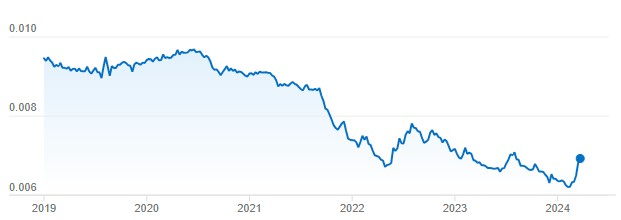
But since, you guessed it, around mid-July, the yen has been getting stronger, and it really started to gain strength on Friday and Monday. That is probably US investors selling dollars to buy Yen to pay off their loans, and of course the increase in the BOJs rate, to unwind their carry trades. To get the dollars they probably sold their US assets, which would not have been good for stock markets in the US. As to why the Japanese stock market declined so sharply, well, its full of exporters that benefit from a weak yen not a strong one. Then it probably got caught up in what looks like a flight-to-safety reaction as well.
It is well worth pointing out that Japan’s stock markets have bounced back today, and strongly, with a 9% gain. European and US markets have stabilised. Some semblance of calm has returned to the markets. Yes, you could call Monday’s events a crash in that it was a sudden, and precipitous drop in prices. However, they are still short of the 10-20% decline from a recent peak that defines correction territory, and well short of a bear market. However, there might well be more to come, especially if economic news continues to fall short of expectation.
DISCLAIMER: James J. McCombie owns shares in Burberry, Kingfisher and Watches of Switzerland. The Storied Investor has no beneficial ownership position in any of the stocks or securities mentioned. No comment in this article should be construed as a recommendation of, or opinion regarding the future performance of, any stock or security or collection of them mentioned herein. Opinions expressed are the author’s and do not represent the views of The Storied Investor.
