
This week Finsbury Growth & Income Trust (LSE: FGT) related its report for the half year which ended on 30 March, 2024. In the report Nick Train, the investment manager, apologised for his poor investment performance over the last few years. A Financial Times article picked a few key phrases from Mr Train’s investment manager report. He said that the UK investment market had been suffering a general “malaise” which is not great for investment trust with a mandate to plunk the majority of its assets into UK stocks. Not having oil & gas and mining stocks in the portfolio, and limited exposure to technology had not helped either.
The recent performance of the Finsbury Growth trust has not been good. Over the last six months, from September 2023 to March 2024, the trust share price delivered 2.7% in return for its shareholders. The FTSE All-Share Index, the trusts benchmark, returned 6.9%. For the year ended September 2023, the trust underperformed its benchmark by 4.4%, the year before that it was 2.6%, and there was a 21.6% underperformance for the year ended September 2021.
Stock market commentators…
The comments section attached to the Financial Times article covering the apology were scathing. In some respects, Nick Train’s performance was disastrously similar to Woodford’s, said one commentator who apparently suffered a 40% loss in a year. I don’t know how thats possible as the worst peak to trough drawdown was 28.7% from September 2019 to March 2020. Another said that Nick Train’s decision to invest in UK equities was pointless, which ignores the fact that Finsbury Growth Trust is benchmarked to the FTSE All-Share and Nick Train also runs global, Japanese and North American equity funds. Many commentators said they performed better—although their verifiable performance figures are of course never forthcoming—and a few echoed the sentiment that it was time time for Nick Train and a thousand other underperforming managers as the game is up. After all, those years where the trust might have outperformed, well, after fees, investors are left with barely anything and all would have been better indexing (except of course if you could copy those outperforming commentators of course, then you could retire within the year). With regards to the fees question, that commentator forgot that the Finsbury Growth is a an investment trust, a closed-end fund, whose shares trade on an exchange so when you see returns derived from the share price and dividends paid they are replicable as stated.
It would seem The Financial Times comment sections are no different to your average Twitter (sorry, X) thread, full of ill-informed, reactionary nonsense, proving that its people, not the platform that is the problem. But buried amongst the attention seeking muck, there was a smattering of decent content. If only there was a way to filter out the garbage, surely thats a sure case for AI. A good deal of the decent content asked why neither the Financial Times article writers, nor the majority of the commenters, bothered to look at Nick Train’s performance over a longer time horizon, and thats something I agree should have been done.
Fixating on short term performance
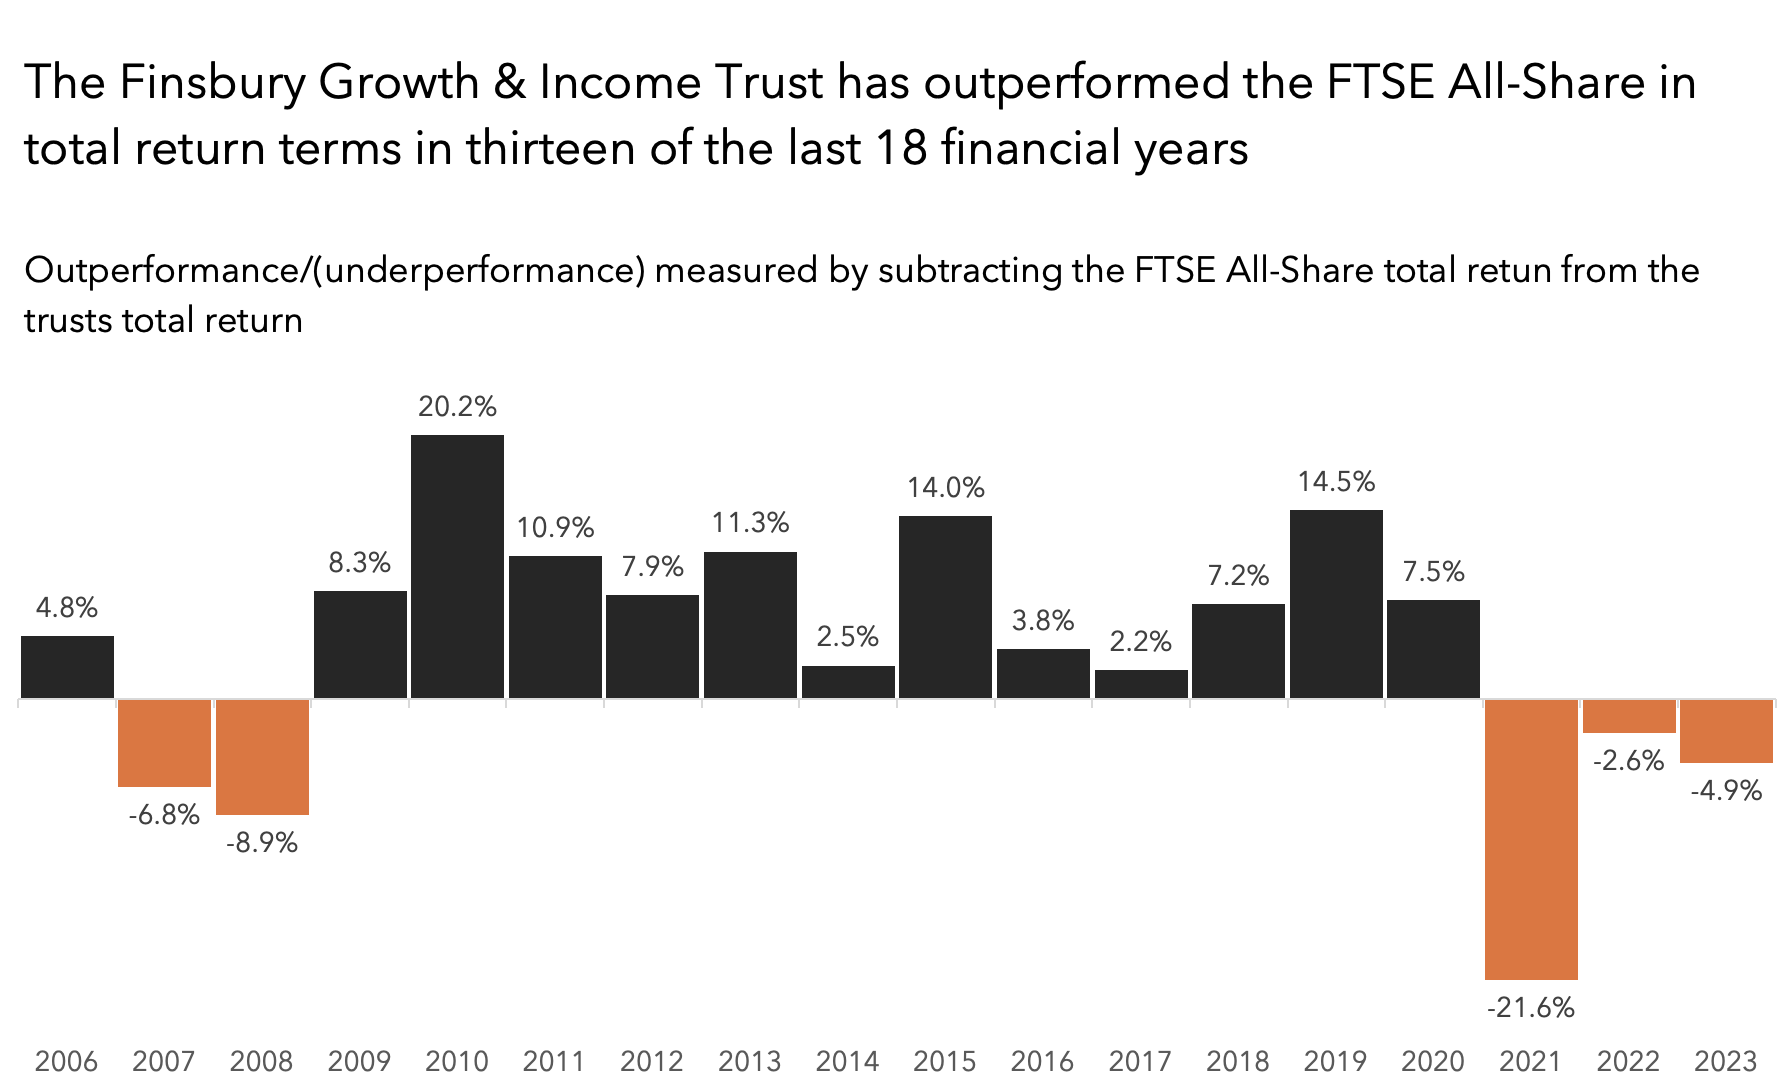
Just a few pages below the portfolio mangers review in that half year report is a chart showing that the Finsbury Growth Fund has outperformed its benchmark over the last decade. We can look even further back to 2005 to get a real feel for the trusts performance and Nick Train’s stock picking prowess. First, we can take the total return per financial year for the trust and subtract the total return for the FTSE All-Share. Do that and yes, the last three years look poor, and that 21.6% underperformance in 2021 is particularly shocking. But, for the 12 years prior to 2021, the trust outperformed. Then there were two years of underperformance in 2007 and 2008, before outperformance returns in 2006.
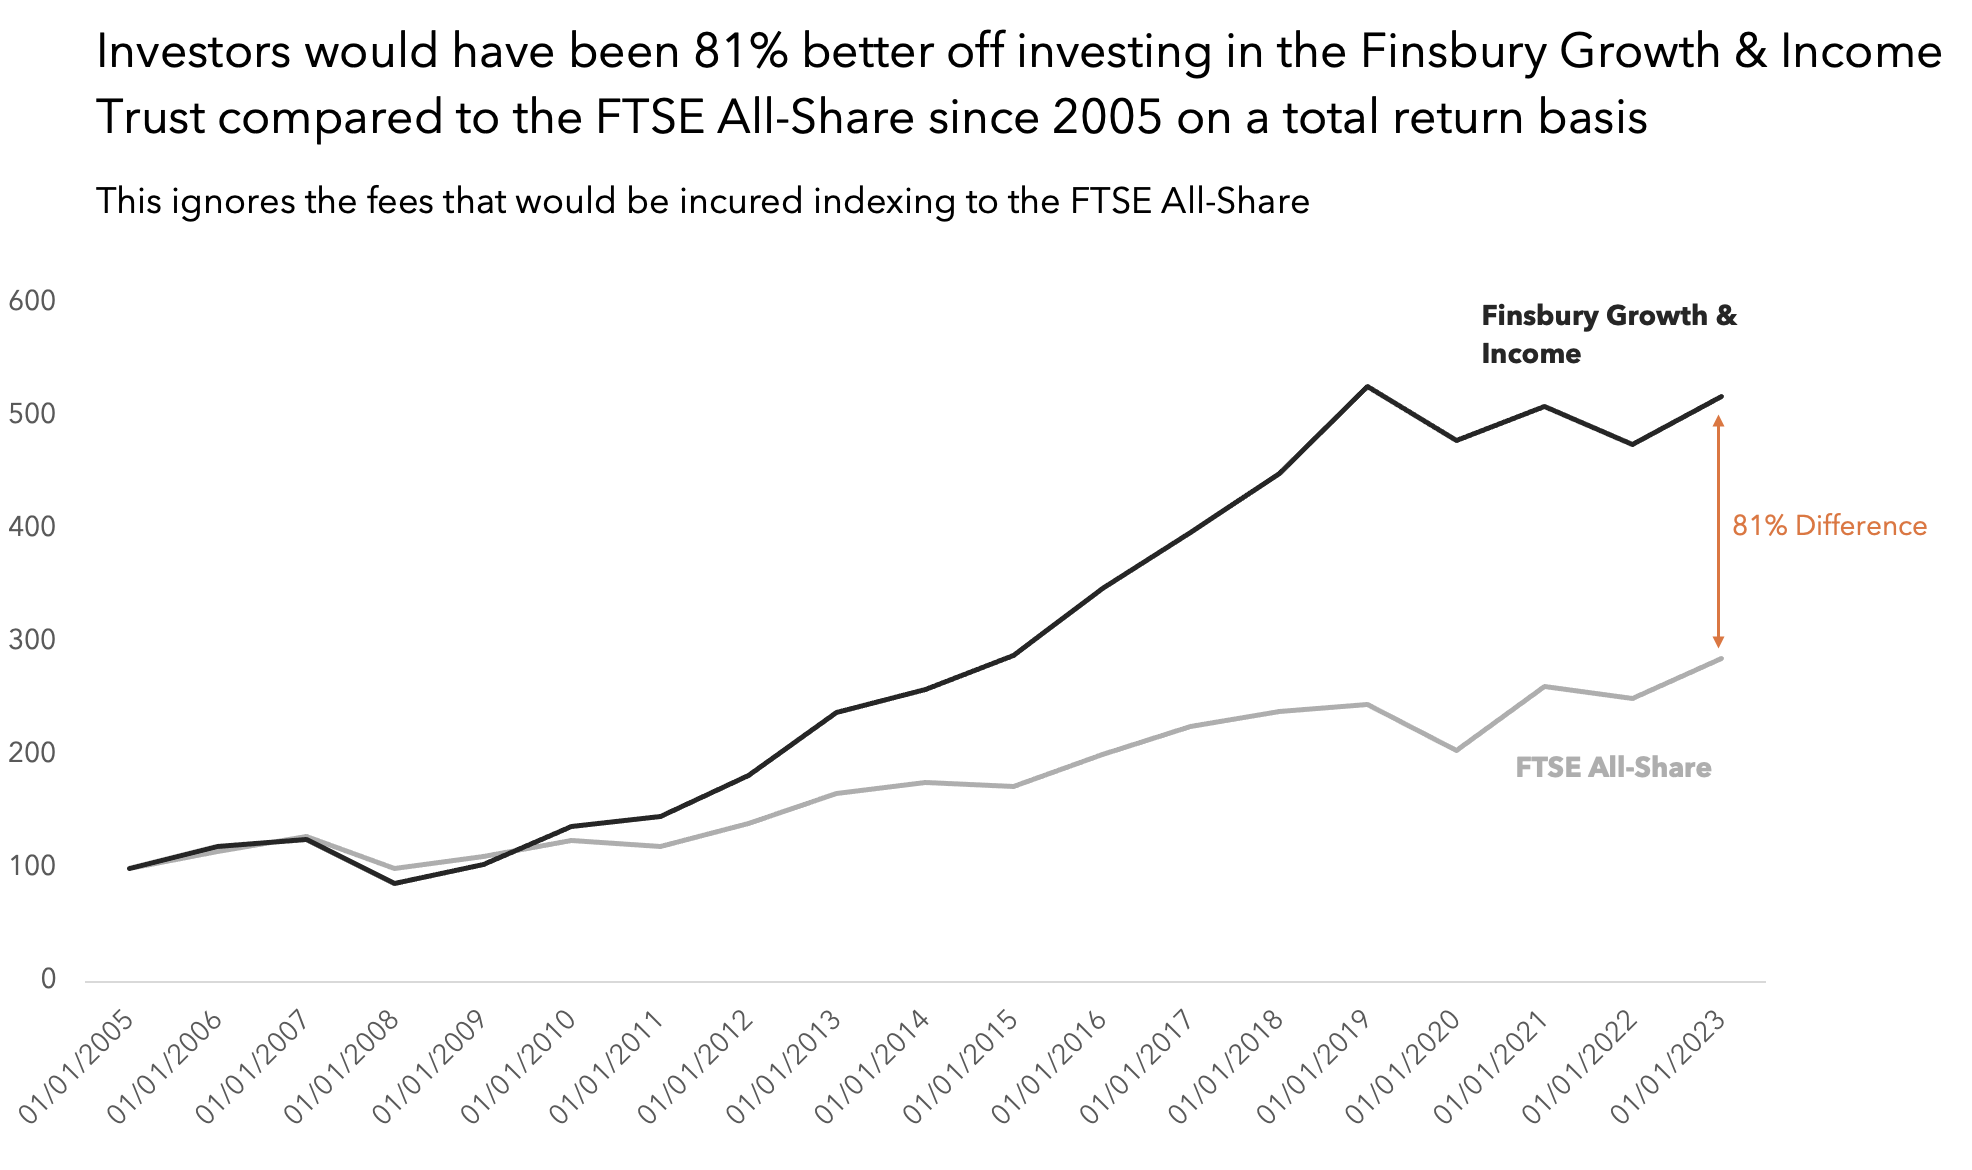
An even better display of performance is to assume that 100 units of currency are invested in the FTSE All-Share and handed to Nick Train to manage in 2005, and see what that amount grows to over the years. Do that and the trust is the clear winner. In 2023 trust investors would have a position worth 517.3 units and whist the FTSE All-Share would have grown the position to 285.4. There is an 81% difference between those two numbers. In this case indexers would have lost out big time to those plumping for active management. In fact the differences would be greater, as the FTSE All-Share total return would have been reduced by fees taken by the company doing the indexing, whilst the trusts returns reflect the its share price movements and dividends paid.
Of course, looking at the chart of the growth of 100—lets call them pounds—since 2005 does reveal a big blip in the last three years as the chart does not really go anywhere for the trust whilst the FTSE All-Share line is heading higher.
Investors don’t outperform the market, or their benchmark, every single year assuming they have a respectably long track record. Sure, over a few years, perhaps someone will take to social media to boast about their market beating performance. But after five years, or a full economic cycle, they tend to go very quiet, see also when Bitcoin goes into a slump.
Its not usual to outperform the stock market all the time
There is a fantastic book called Excess Returns: A Comparative Study of the Methods of the World’s Greatest Investors by Frederik Vanhaverbeke. In it the author delves into the returns made by a raft of the most well-known, respected and successful (over the long term) investors in history. Like most financial works the bias is towards the US, and in particular the S&P 500 which serves as the benchmark throughout. The study includes the likes of John Templeton, who over 37 years managed to beat the market by just over 4% per year right up to Jim Rogers and his near 30% outperformance over 11 years. Buffett is in there as well with 12% outperformance per annum for just over half a century.
These are the investing greats, with the track records to prove it. They beat the markets over the long run, but they did not beat it every year. There is one chart I love that is included in a presentation by the author about his book. It plots the annual compound excess return the investors achieves over the S&P 500 (including dividends) over all available ten year periods against the miss ratio, which is defined as the number of underperforming years divided by the total number of years.
What the chart, which is presented below shows, is that every great investor has years of outperformance. Joel Greenblatt had a miss ratio of 10%, meaning that despite beating the S&P 500 by 34% annually on average, one in ten years was an underperforming one. Warren Buffet got beat by the S&P 500 every six years and Peter Lynch was about the same, both, however, beat the S&P 500 by about 12.5% per year on average over the long run, despite miss ratios between 0.15 and 0.2. A miss ratio of around 0.3 looks fairly typical.

Nick Train and his Finsbury Trust has a miss ratio of 0.28 (5/18) over the last 18 years. Thats not bad, its not good, its typical. And, with that miss ratio the trust’s total return performance produced a gain 81% higher than the FTSE All-Share benchmark delivered.
Nick Train is not finished
I like Nick Train’s approach to investing. A lot of what he does chimes with me. He has stocks he likes, and stocks he doesn’t and stocks to the following types of companies for his portfolios: Luxury and premium products; beloved, mass-market consumer brands; data and software companies and providers of wealth management services in the UK. That list doesn’t include miners and fossil fuel companies, so that explains why he missed out on their post-pandemic boom.
The bulk of his holdings are in the portfolio because he has a thesis as to why they will outperform in the long term. Thus his performance is to be judged in the long term. Now, investors who point too long term appraisal as preferential could be accused of delaying critique, given short term fluctuations. But that misses the point. If a market participant likes to play short term momentum, and has skill in picking stocks or other assets over months to a few years, and they are buying and selling within that time frame, then short term performance appraisal fits. But someone who rejects that, and sets out hold stocks for longer and turns over their portfolio over decades rather than days, should not be judged on a short term basis.
That does not mean that three consecutive years of underperformance are ignored. Nick Train has apologised, so he recognises the problem. And he is making changes. What he has done is increase exposure to data and software companies, by first adding Experian, and later Rightmove. The former is basically a data broker of consumer and corporate credit information. The later is a platform for listing and selling residential and commercial property. He hopes that will arrest the decline. Only time will tell if it does. As to whether he should move on as suggested, I don’t think he is finished, at least not yet.
