
UK stocks markets have disappointed so far in 2024. The FTSE 100 and FTSE All-Share are both down since the new year rolled around. In contrast the S&P 500 is up, handsomely. The last five years tell the same story. The FTSE 100 is about where it was a half decade ago, yet the S&P 500 is worth about 1.8 times more.
The lacklustre relative performance of the UK markets leads to talking of them being undervalued. I think thats probably true. But I—a UK based investor still willing to invest in UK stocks—seem to be a dying breed. Data from the Office for National Statistics (ONS) shows the proportion of UK shares held by overseas investors at the end of 2022 hit a record high of 57.7% of the value of the UK stock market whilst the proportion of UK based shares held by Brits fell to 10.8%, down 1.2 percentage points from 2020.
Alright, it’s not retail accounts moving out of UK stocks, or not investing in the first place, that are shifting those ONS statistics, at least not directly. Instead its the UK based pension funds and insurance companies that are increasingly falling out of love with UK stocks, and the ONS report confirms this. Now this might be due to a general dissatisfaction or lack of confidence in UK stocks and shares but as an interesting article in the 27 January, 2024 edition of The Economist notes, big private equity firms like Blackrock have been taking stakes in insurers in exchange for managing their assets. That means Blackrock and co are investing the insures balance sheets in their own alternative asset classes like private equity and the like. The insurers and pension funds are reaching for higher returns and alternative assets have been providing it. You only have to look at the swollen balance sheets of endowments, who have had a penchant for more esoteric investments for years as proof.
In terms of returns, perhaps the UK stock market is just not whetting the appetite anymore. But, maybe it could. There is a line that there is value to be found in British stocks, and if rest of the investing universe catches on to the value, returns should follow. Whereas investors, both individual and institutional, might not appreciate the value at the moment, corporate ones seem to. KPS Capital partners submitted a bid for UK based chemical firm Elementis in September. Management seem to be holding out for 180p per share rather than 160p. There have been other bids and some have been accepted.
Now, hopefully, the UK market does not end up losing yet another storied UK company: Element-is dates itself back to 1844. I hope that management and shareholders have the faith to hold out and realise the value for themselves that other suitors seem to be seeing. So, lets explore the notion of the FTSE All-Share and the like being bastions of value rather than lacklustre underperfomrers. The US stock market seem to be the benchmark, so making a comparison to it seems as good a place to start as any.
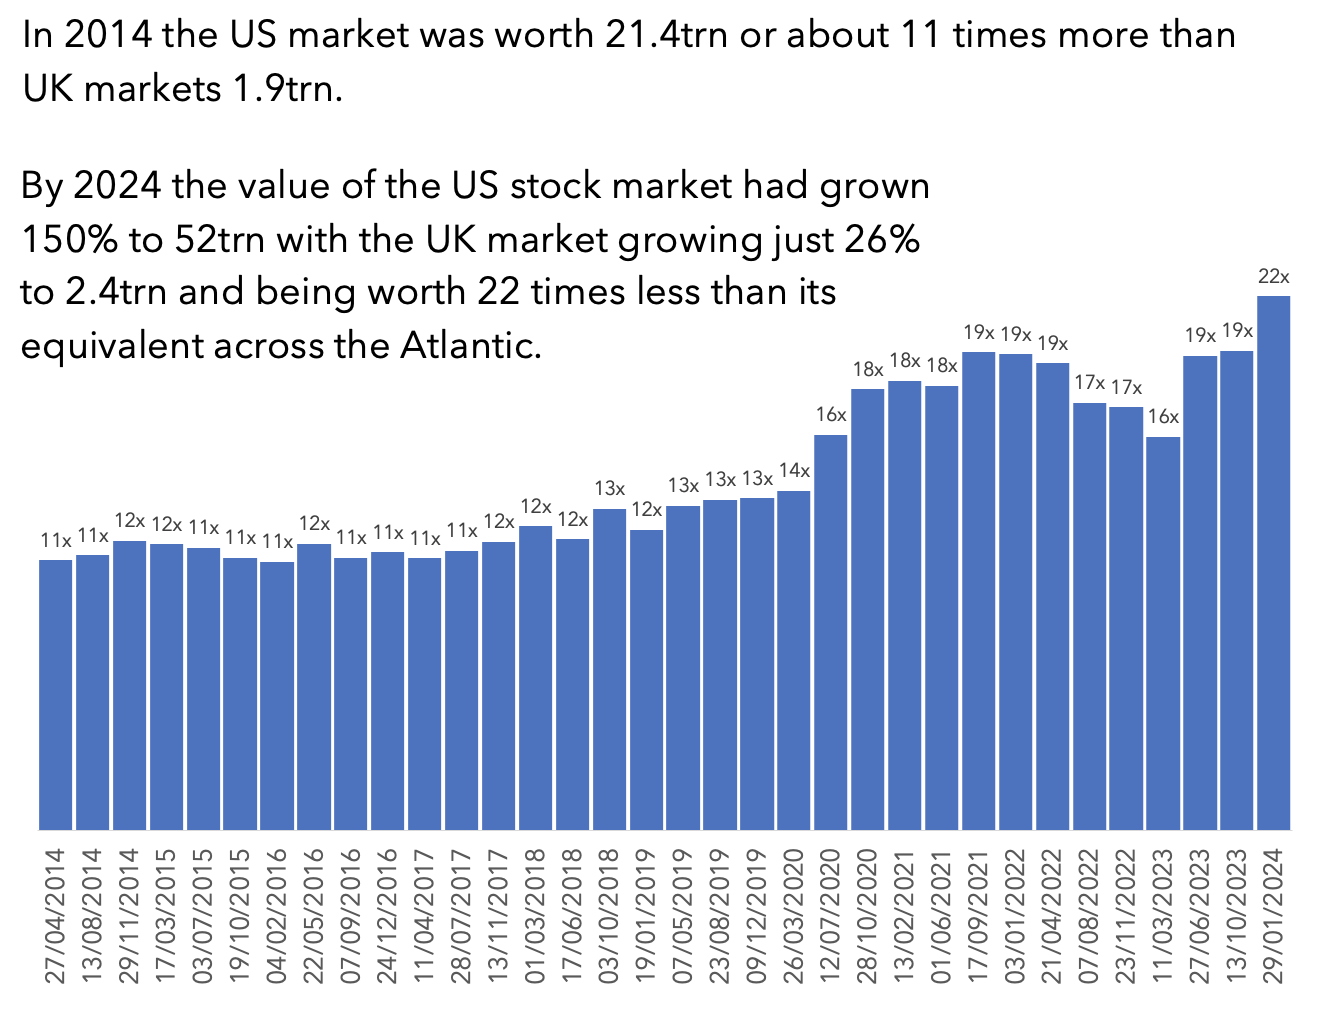
The US stock market is 21 times larger than the UK stock market
In terms of size there is only one winner. The US market is worth around 52 trillion dollars now compared to the UK’s 2.4 trillion, or 21 times as much. Ten years ago the US markets were worth 11 times more (21.4 trillion USD versus 1.9 trillion USD) so the gap is widening: the US market has grown at 150% over the last decade compared to the UK’s growth of 26%.
Bigger nations must have bigger stock markets. The US is larger, its population was 334,998,398 at the 2021 census. The UK only has 67,081,000 million people according to a 2020 census. There are five times more Americans than there are Brits, of course the market is larger. But, that does not explain the size gap alone. US markets seem to be doing a much better job at capturing global value.
And thats not really surprising when you consider the names that appear in US indexes. Microsoft, Apple, and Alphabet (which owns Google) for example, are ubiquitous in out daily lives. We, by which I mean everyone on Earth, sees their logos and uses their software and phones multiple times a day. That’s not to say the UK doesn’t have its fair share of corporate heavyweights. I see a Shell logo most times I go for a drive. But for every Shell and BP the US market scan offer a Netflix, or an Meta. If you own any type of device be it a smartphone, laptop or tablet then you have probably have something made by NVIDIA or AMD right beside you right now.
All the names just mentioned, save for AMD, and including Tesla, are part of the magnificent seven, a group of high profile, high performing stocks that have captures the publics attention. This group is an expansion of the five FAANG stocks, with an added chip maker (NVIDIA) and electric car company (Tesla). And the investing public can’t be faulted by having their heads turned by these high-flyers. The worst performing magnificent seven stock, which was Alphabet, grew by a whopping 439% over the last decade. The best performing, which was NVIDIA, has grown by 12,600%. Now, you might find examples of equally high flying stocks in the UK market. However, you won’t find one that kicked off 2014 with a market capitalisation that was already in the tens of billions. Posting absurd growth from an already massive base is a hallmark of the seven.
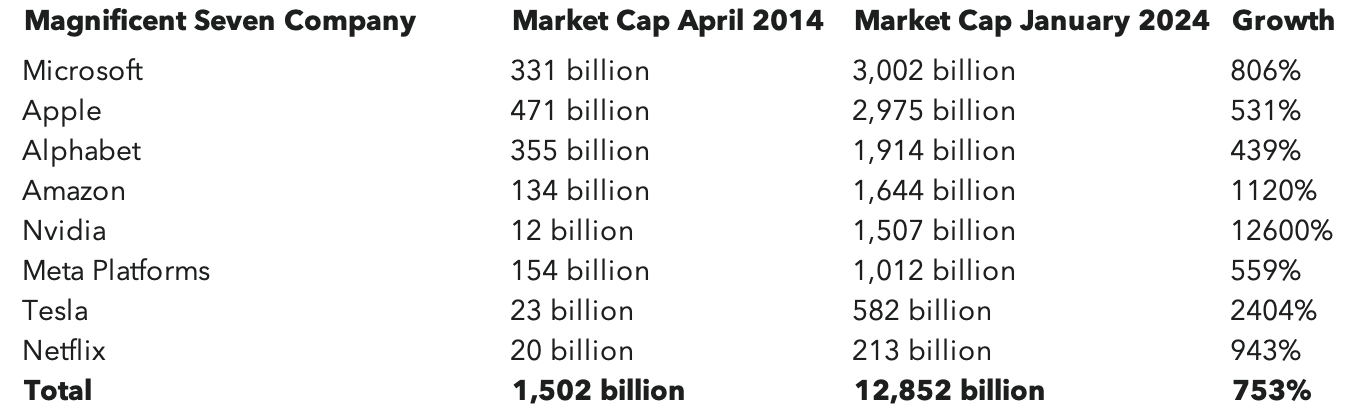
The magnificent seven alone are the engine rooms for US market growth. In 2014, the magnificent seven had a combined market capitalisation of 1.5 trillion US dollars, almost as much as the entire UK market. Over the next ten years they grew 756% to 12.9 trillion combined, which is 5.4 more than the entire UK market. But, the UK market can’t blame the seven for falling behind. The rest of the US market posted 103% growth since 2014, which still beats the UK’s markets efforts.
Still, you can’t take away from the fact that the Apple, Amazon and co are utterly unrivalled in their ability to drag the US stock markets to dizzying heights. They were worth 7% of total US stock market capitalisation in 2014, now they are responsible for three quarters of it. These stocks are the US markets.

If 75% of a market capitalisation is bound up in the stocks of seven techy companies, with their attendant high price-to-earnings (P/E) ratios then there is one reason why the idea that the US markets might be expensive compared to the UK ones.
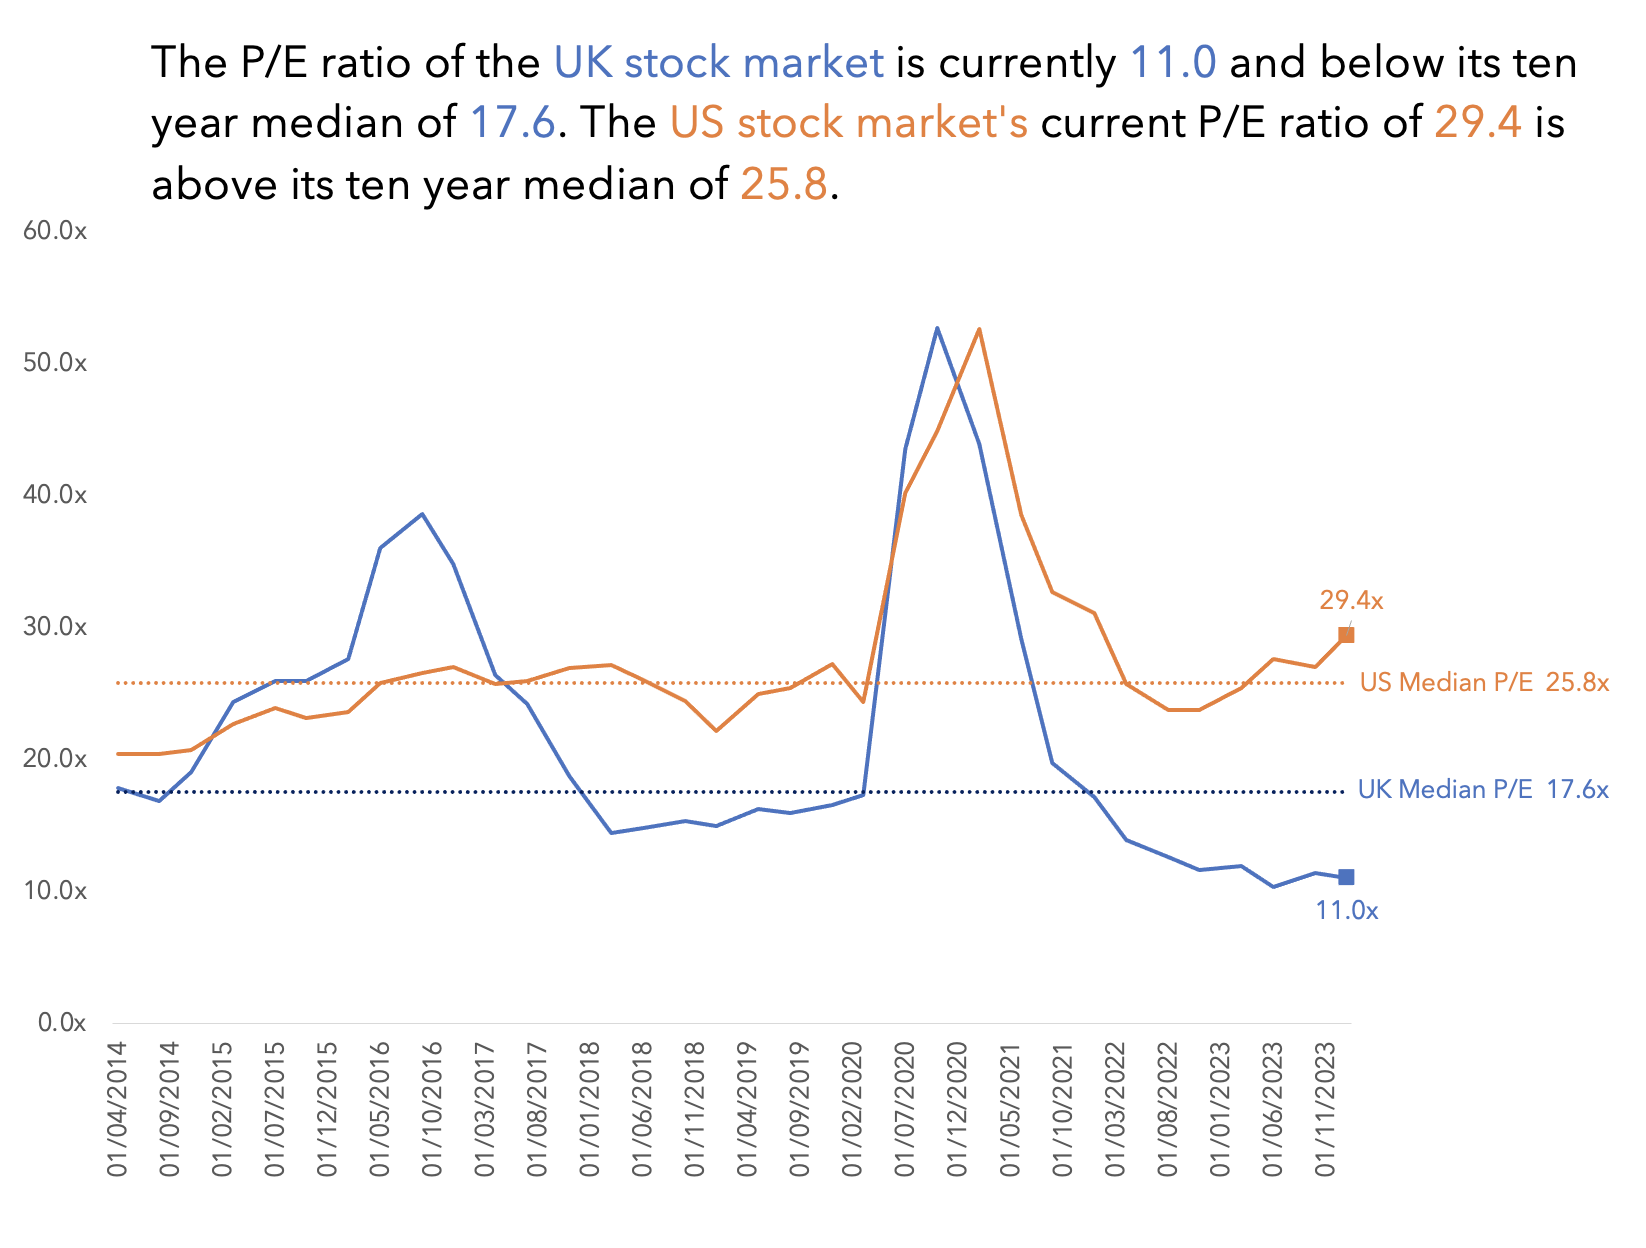
The US market is more expensive than the UK at least according to P/E and P/S ratios
The median P/E ratio of the US market over the last ten years is 25.8. The UK stock markets median P/E ratio is 17.6. That would suggest the US market is currently overvalued and the UK one its undervalued.
Turning to price-to-sales (P/S) ratios (which should be enterprise-value-to-sales really, but hey, we have what we have) and its a similar story. The ten median for the US market is 2, and currently the P/S ratio is 2.4, suggesting the market is overvalued. The UK market has a median of 1.3, and currently the P/S ratio is 1, which suggests it is undervalued.

So, UK markets do look undervalued at least in comparison to US markets which look undervalued. But, this might be justified.
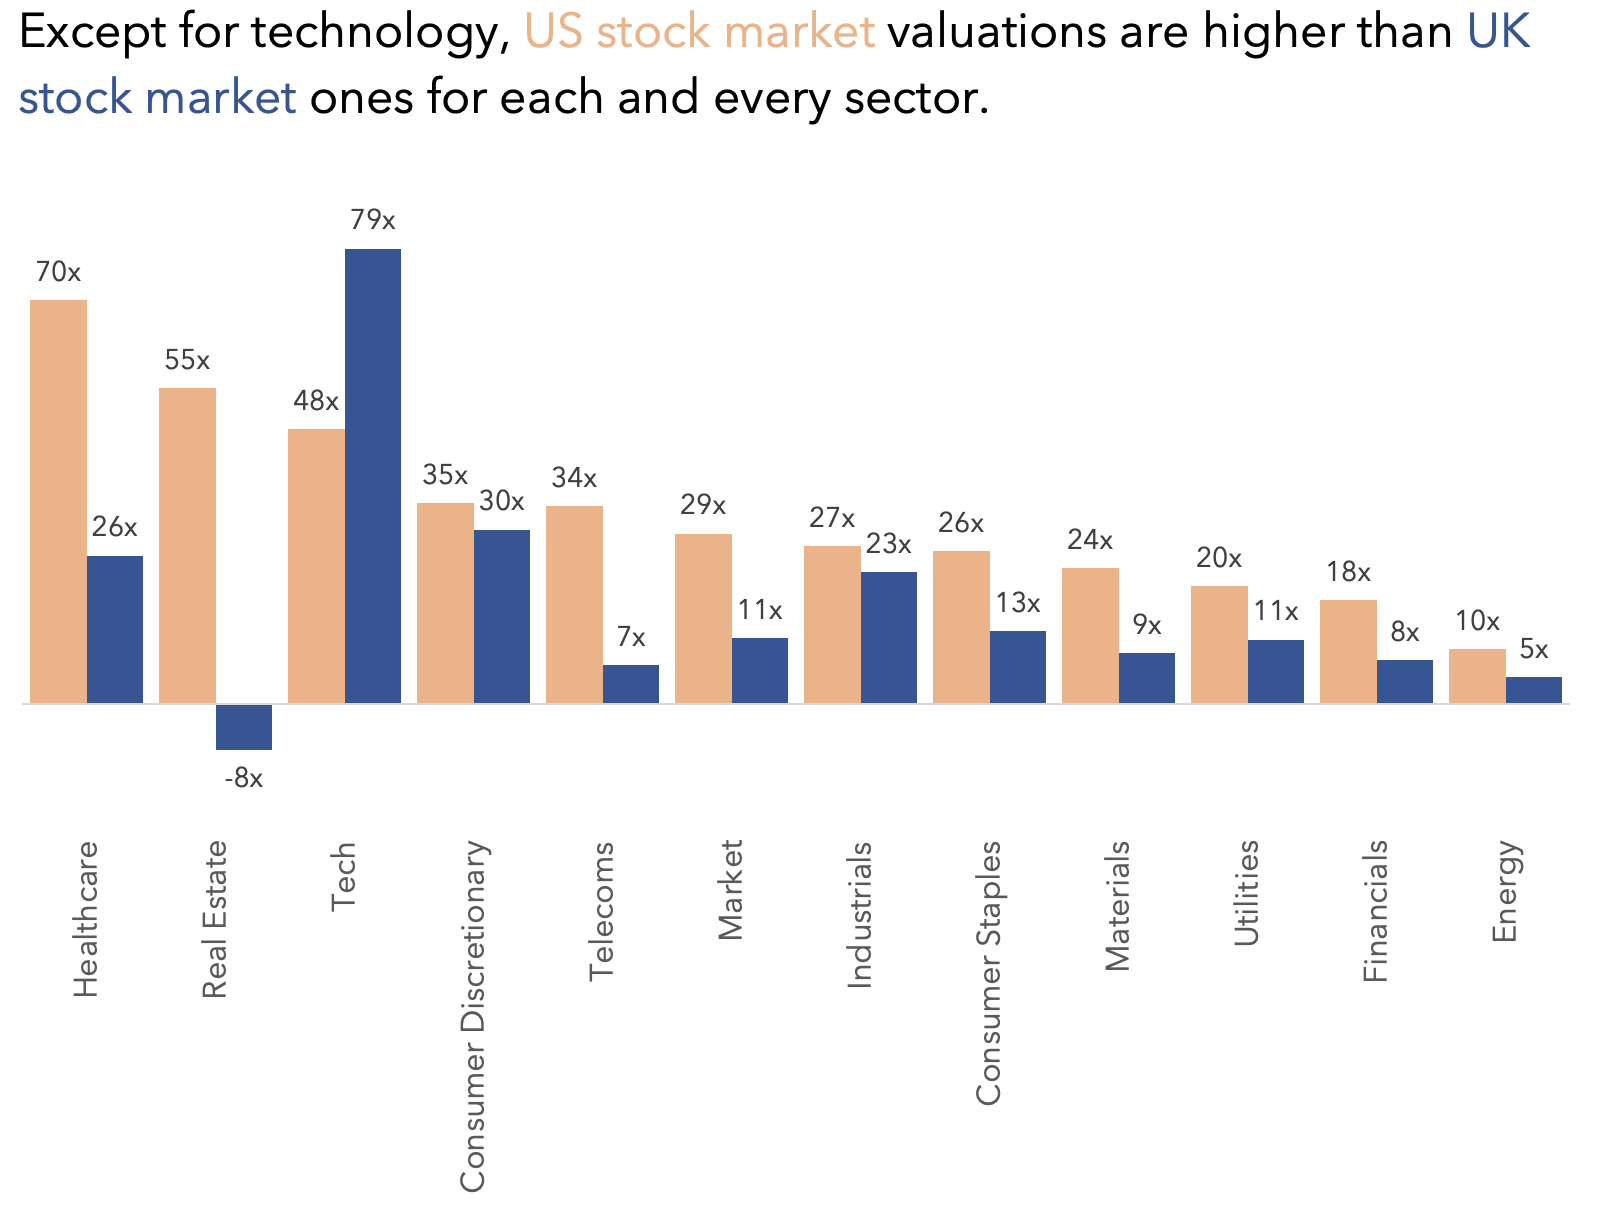
The US stock market has a lot of tech stocks and the UK stock market doesn’t
Take a look back at the magnificent seven list. Five are classified as technology companies. The defining features of tech companies are high fixed cost, but low variable cost products and services. In other words a piece of software costs a lot to develop, but once it is it can be packaged up and sold digitally for very little extra. In this way tech companies, particularly the software ones can rapidly pay back the fixed costs, and after that devote most of the sales price towards profit, assuming they sell in sufficient volume. Investors like that kind of business model. Microsoft has this kind of business model.

Most of the other companies here might not have this characteristic, despite the tech label, and some are not tech stocks at all, at least by categorisation. Apple makes, or rather designs iPhones in California and contracts their manufacture to East Asian companies, amongst pother products. It doesn’t have the low variable cost, high fixed cost structure that Microsoft might have. What it does have is the ability to charge premium prices for its in demand products and grow a cash pile that puts a lot of entire economies to shame. Investors like that kind of business model.
Although they develop at high fixed cost and distribute for low variable cost, they don’t charge users directly for their stuff, but other companies throw money at Meta and Alphabet to get their products and services in front of the billions of eyeballs that are already accessing the online world through their portals. Nvidia supplies the chips that power computers and data centres and AI services. Netflix dominates the US movie and series streaming market, and has a good foothold globally. Tesla is at the bleeding edge of the electrical vehicle revolution. Now, change might be afoot with all of these. Business models might be changing. However, investors like these stocks, they are exciting, and they have delivered outside returns.
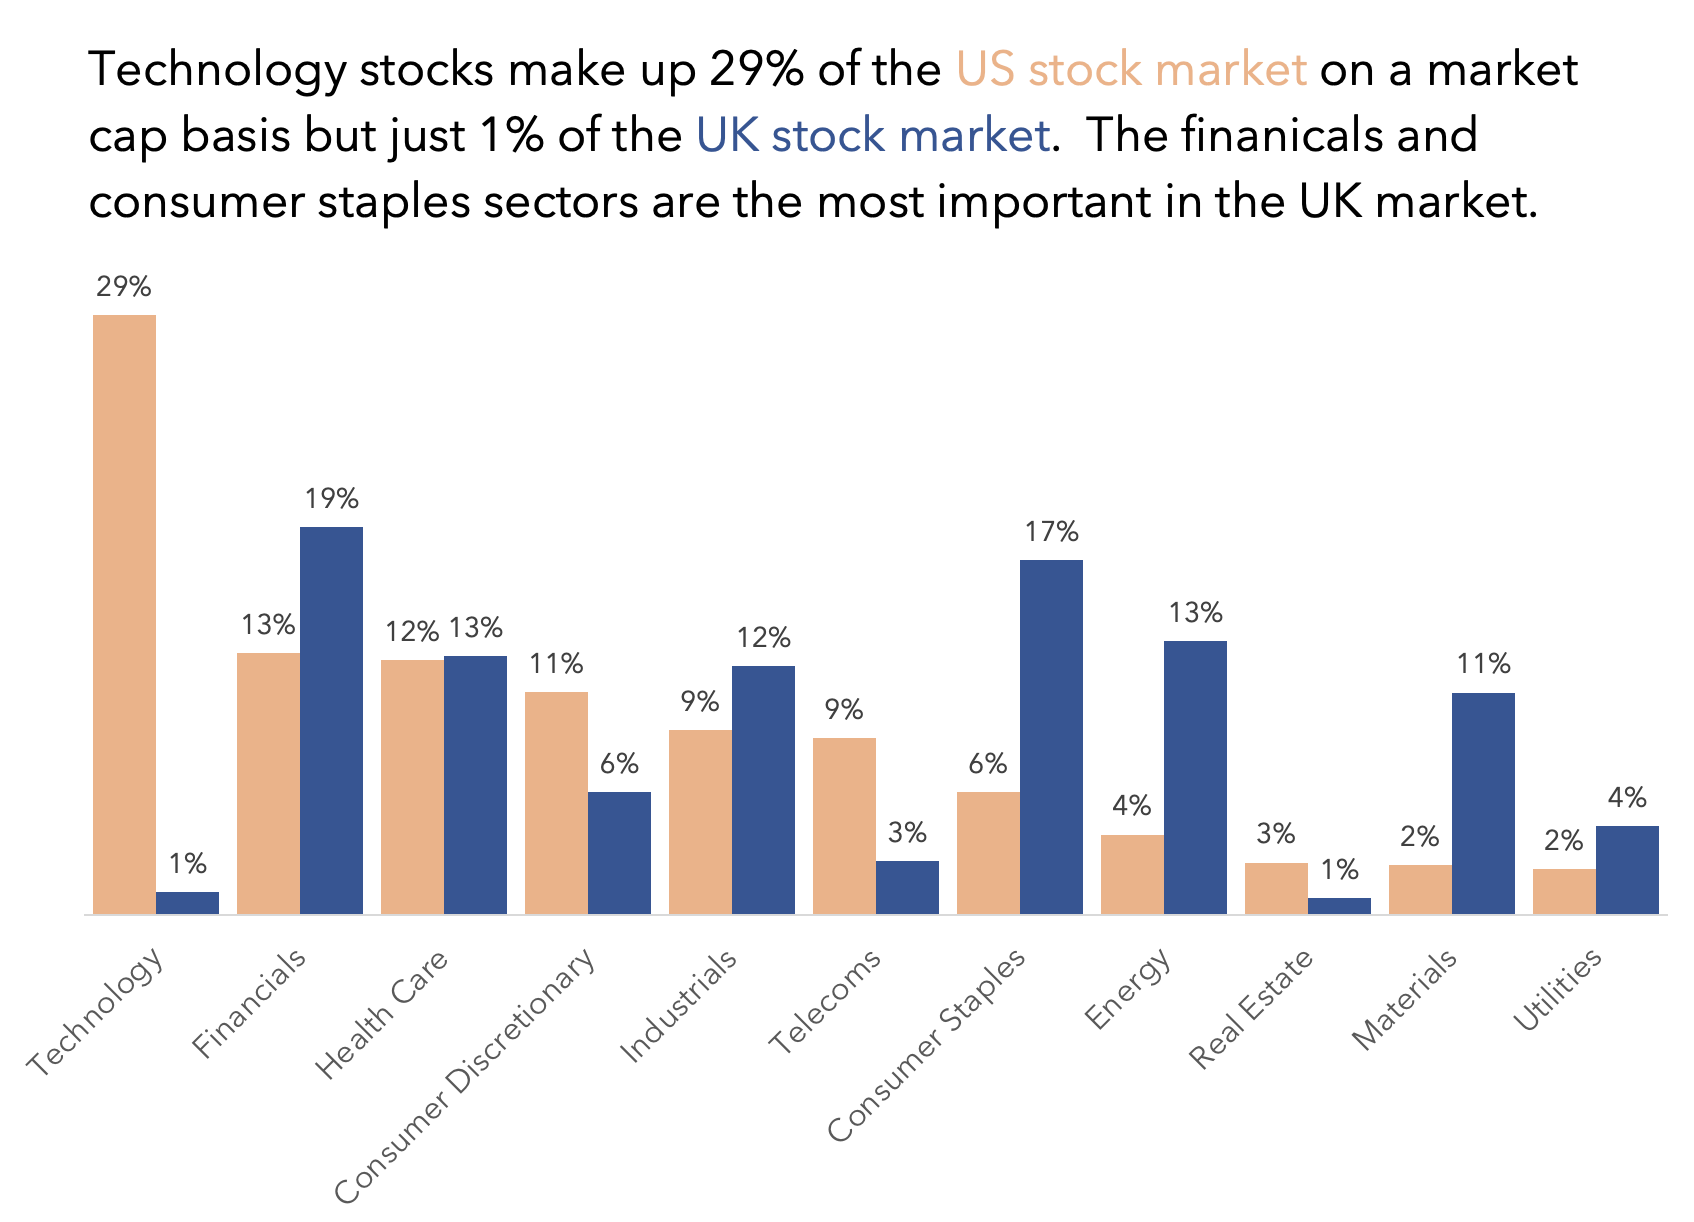
Outside the magnificent seven, the US markets have a plethora of similar stocks with the same themes and credentials, and one of the big ones is being used and recognised globally, like Amazon whose trucks deliver all sorts to seemingly every home every day. A full 29% of the US stock market is made up of technology stocks which fit the bill. Analysts expect earnings growth of 14.9% annually in this sector. Then you have financial and healthcare stocks which make up 13% and 12% of the US stock market respectively: these are forecasted earnings by 14.2% and 18% respectively.
These dominant, high earnings growth sectors contribute to the 14.9% earnings growth expected for the US Market. Now, in comparison the UK stock market is light on tech stocks. Just 1% of the market capitalisation is devoted to them so despite the 21% forecasted earnings growth, which is higher than the US, it doesn’t add much lustre to the overall markets expected return profile. The big sectors are financials and consumer staples with market shares of 19% and 17% respectively. Analysts expect these UK market sectors to grow their earnings at 7.3% and 16.3%. In the latter case thats not bad, but the former is disappointing in comparison. And its compounded by the energy sector, which is responsible for 13% of the market share but is forecasted to have a relatively paltry 2.6% earnings growth. And it’s this sector that the UK stock market might have claim to having global names in the likes of Shell and BP. The trouble is that these names are becoming more infamous than famous.
So all in all the US stock market has more stocks in sectors that investors seem to find attractive, and with good reason, as the expected earnings growth and track records alone incite excitement, and thats before we add lets say non-qualitative factors like being market dominating, cutting edge, household names. Money is flowing into the US markets and out of the UK ones. Evidence can be found in the price movements of the largest US indices, which are up so far in 2022, and those of the UK which are down. It’s the same story over the last five years as the US market has risen by 73% whilst the UK market is flat.
The UK stock market probably offers better value than the US stock market
Given the disparity in returns it is perhaps easy to see why, despite all thats been said, many, including me, might feel the UK market is indeed undervalued. We have seen that the US market has above median P/E ratios, which suggests overvaluation, and the converse is true for the UK stock market. I stayed clear of saying the US was overvalued, only going so far as saying the findings were suggestive, and the UK market was treated similarly. However, I am comfortable in saying the US market is expensive and the UK markets look cheap, because cheap and expensive can just be functions of a price being lower or higher than “normal”.
But being overvalued means the value of what you get is not worth the price paid. Undervalued means what you get is worth more than what you paid for it. The US stock market is forecasted to grow its earnings by 14.9% and the UK stock market 12.7%. An investor is getting more growth with the former than the latter, so the latter could reasonably appear overvalued, and the former undervalued, as a consequence of reflecting the disparity in expected growth. And thats without considering all that has been said about the favourable make-up and properties of the US market compared to the UK.
The US markets PEG ratio is 1.97. The U.K. markets PEG ratio is 0.87.
Since PEG ratios below one are considered better, on a growth t a reasonable price basis, the UK comes out on top.
*Analyst forecast 12.7% earnings growth for the U.K. on a P/E ratio of 11. Analysts forecast 14.9% earnings growth for the US on a P/E ratio of 29.4.
But lets look at this through the price-to-earnings-to-growth (PEG) ratio. This divides the P/E ratio by the forecasted earnings growth (or historical if thats all thats available) percentage. PEG ratios below one are considered better than ones above one, with one being parity. The US stock market has a PEG ratio of 1.97 (29.4 / 14.9) whilst the UK stock market comes in at 0.87 (11 / 12.7). On this metric, there are ground to suggest the US market is indeed overvalued and the UK market is undervalued, assuming the analyst estimates are correct.
Does this mean the investing world will necessarily wake up and pour money into the UK stock market? No. And even if it did, does this mean buying UK stocks indiscriminately will pay off? No, there would of course be winners and losers. Does a PEG ratio negate all the other points concerning the attractiveness of the US market compared to the UK one? No. Is all this a desperate attempt from an investor who has some of their money invested in the UK stock market to beguile themselves into thinking they have reason to hope for a time of roaring prices? Possibly. At the end of the day, each investor has to assess all the evidence available, consider their own particular willingness and ability to take risk, and their own unique circumstances, and make their own informed decisions.
DISCLAIMER: James J. McCombie owns shares in Shell. The Storied Investor has no beneficial ownership position in any of the stocks or securities mentioned. No comment in this article should be construed as a recommendation of, or opinion regarding the future performance of, any stock or security or collection of them mentioned herein. Opinions expressed are the author’s and do not represent the views of The Storied Investor.
