
It’s Friday and its therefore time for The Stored Investor’s chart of the week. Each week we publishes a chart that is at the very least tangentially related to investing.
To make this interesting the chart is shown without a title or axis labels, just the numbers, no units. A number of other hints are available below to be opened as seen fit and of course skipping to the big reveal is perfectly fine as well.
Here’s the chart:

Hint 1
The are numbers of things, or a rather a count of how many things on the y-axis. Those are years (obviously) along the x-axis.
Hint 2
Two countries are being compared. Think about what countries might have seen a shift if the relative standings on the world stage.
Hint 3
Have another read of the title of the post, there is a clue there. Think of other ways to say what is said after the #1: bit.
Click here to reveal the chart in full and the rest of the discussion
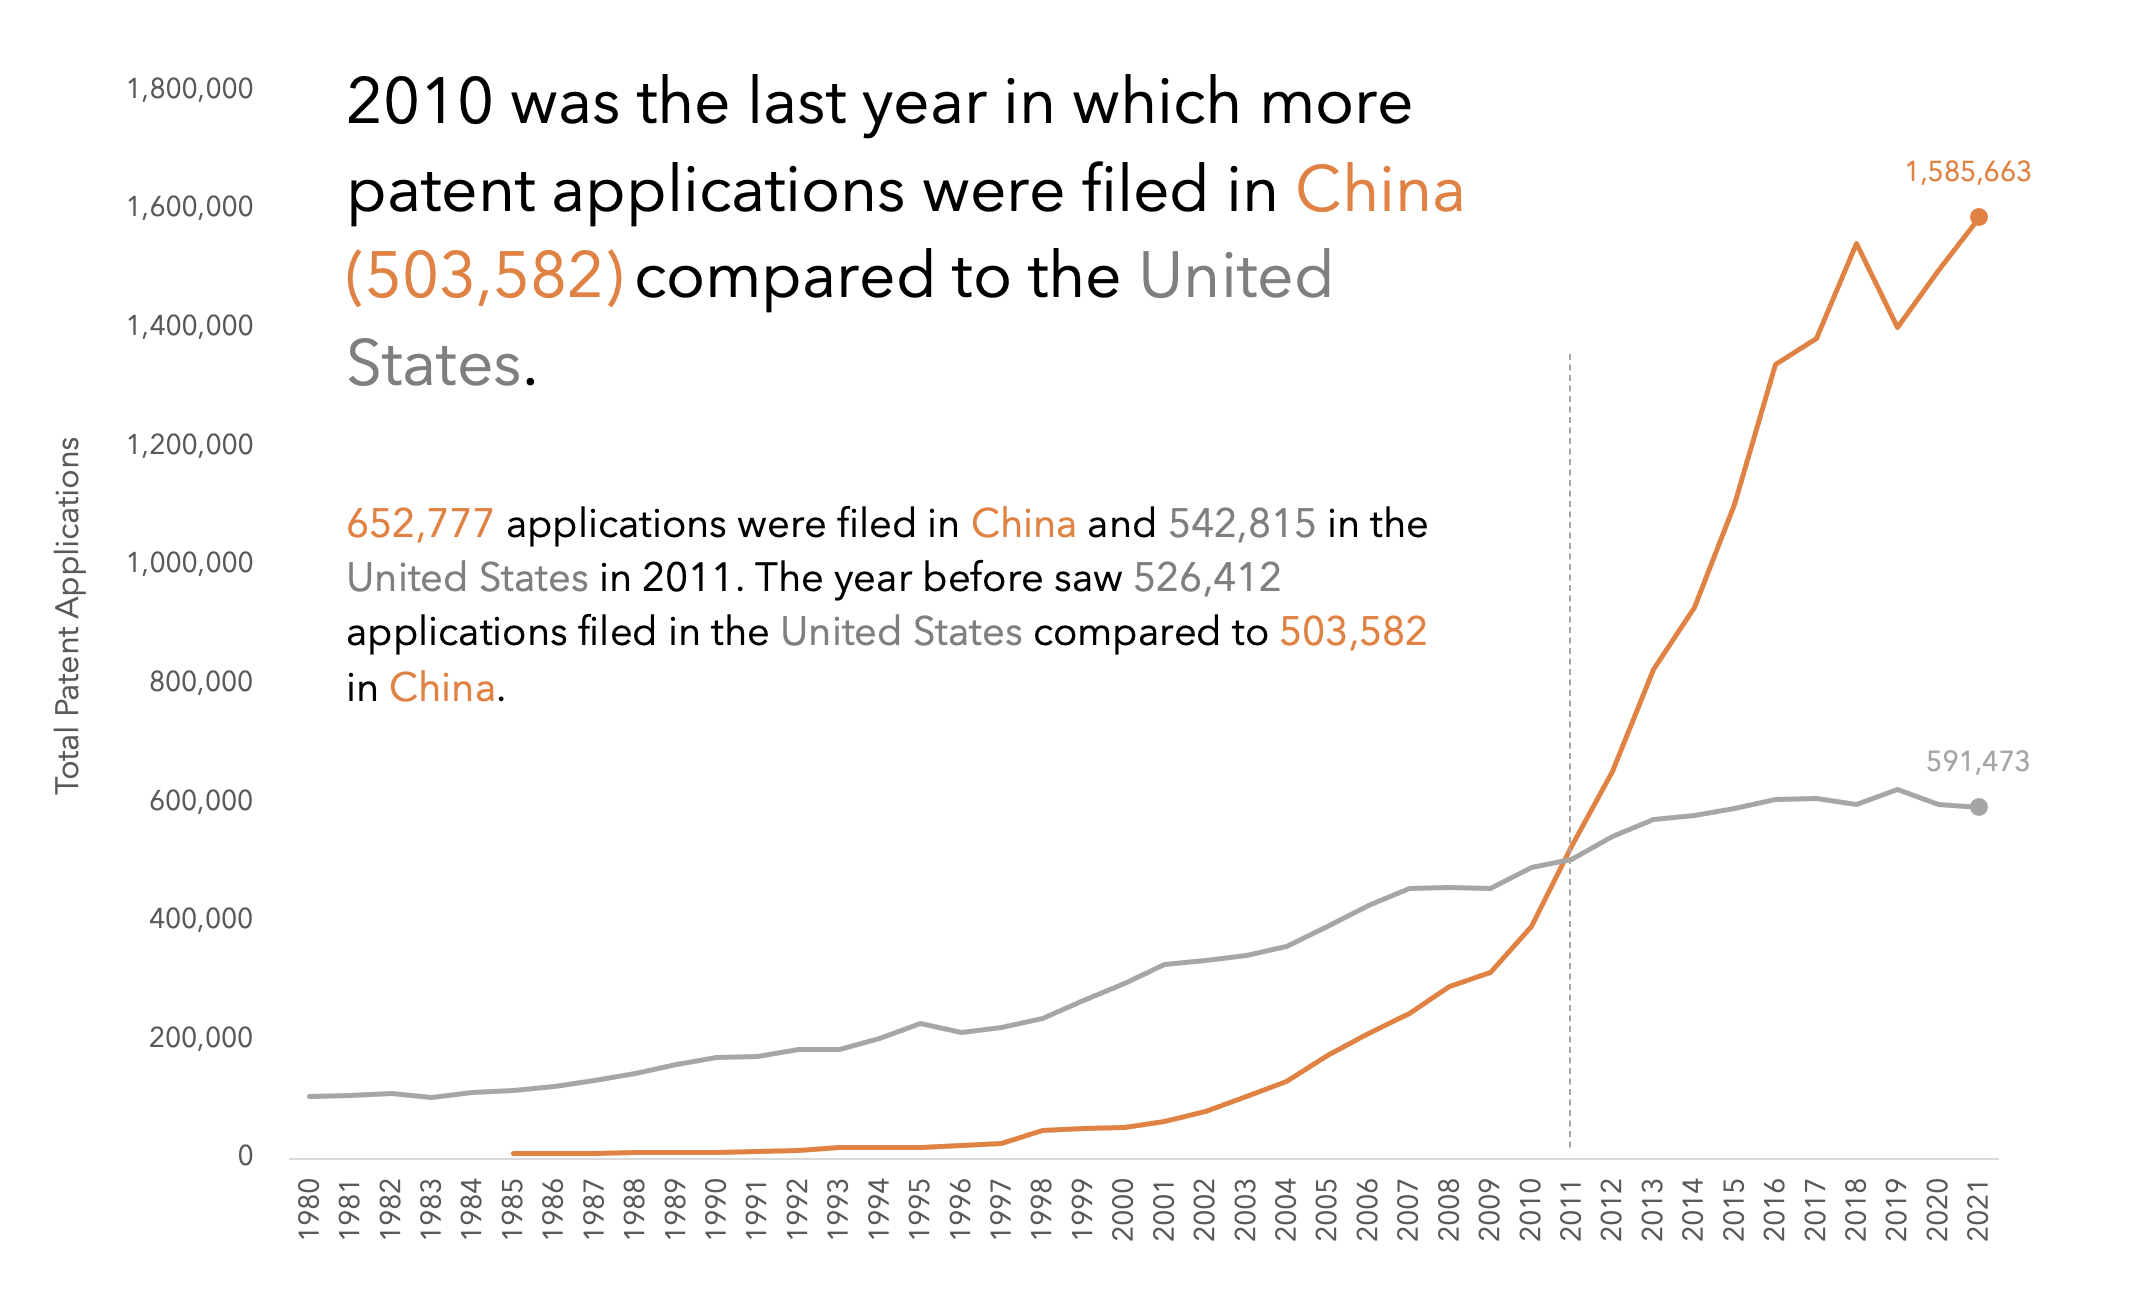
The chart tracked the number of patent applications made in the US and China since 1980: well, 1985 really as no data exists for China before that date. In 2011 more patent applications were filed in China than the US for the first time, and in 2012, in fact, its been that way ever since. In 2021, about three times as many applications were made in China (1,585,663) compared to the US (591,473).
Patent applications could be considered as an indicator of the level of invention, innovation (can you patent stolen IP) and creativity (perhaps that means ideas that are inspired, heavily, by something else that already exists) in an economy. But, what use are patent applications if they are rejected for reasons like the invention being obvious, not novel, incorrectly filed, or not patentable.

Relatively few applications were approved in China in the 1980s. and in the mid to late 1990s. Since about 1998 the trend has been for higher approvals and the rate hit an all time high in 2021. But even at 43.9%, China is still not quite hitting the US average approval rate of 51.5% set between 1980 and 2021.
