
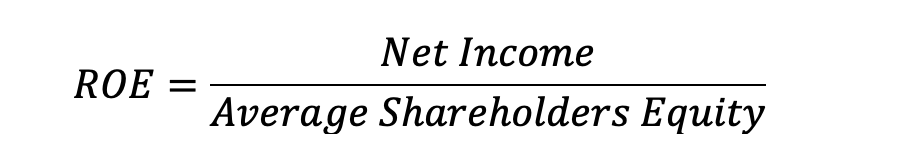
Many investors will be familiar with return on equity (ROE). It is calculated by dividing a company’s net income by its average shareholders equity. Net income is calculated before dividends, but after preferred dividends and interest payments to debt holders. So, the ROE shows how many pounds (or your currency of choice) in profit the company makes per pound of equity capital invested.
The higher the ROE the better because it means the company is more efficient in using the money they got from shareholders and turning it into returns for them. But, a single ROE is not as much use as making comparisons over time, to see if the company is doing a better or worse job at creating value for shareholders. Also, comparing one company’s ROE to others in the same industry, or the industry average is something that investors should be doing.
Balancing income
Before go further, we should address why we are using average shareholders equity. Well, a balance sheet is a point in time summary of financial position, or it lists what a business owns (assets) and what it owes (liabilities and equity). Balance sheets exist from the formation and capitalisation of a business.
An income or profit and loss statement is a summary of what a business brought in (sales or revenue, although these are not always the same) and what it spent (costs) over a period of time. It links balance sheets together (with the cash flow, comprehensive income, and changes in equity statements) and shows how the assets, liabilities and equity accounts changed as a result of trading between the two balance sheet dates.
Since an income statement links two balance sheets at different points in time, it is normal practice to average balance sheet items when making calculations. So, from now on lets assume that when we say shareholders equity or any other balance sheet item, there is an implied ‘average’ in front.
DuPont Analysis
We can pull apart the fraction on the right-hand side of the ROE equation as follows:

This works because the total assets in the bottom part of one fraction (denominator) cancels with the total assets in the top part of the other (numerator) giving us back the original equation for ROE. That’s good but we can do better. We can split return on assets in two by introducing sales (or revenue).

This is the DuPont analysis as it first appeared. In plain language it says that ROE is found by multiplying the net profit margin by the asset turnover by the equity multiplier. Most will be familiar with the net profit margin. Asset turnover is a measure of how efficiently a company is using its assets to generate revenue. Finally there is the equity multiplier or financial leverage ratio. If the company had no debt the ratio would be one. So, the higher this ratio above one, the more debt there is in the capital structure.
Let’s say a company’s ROE has increased. An investor using the DuPont breakdown can attribute the increase to changes in the three terms. Obviously improving net income margin and efficiency as measured by asset turns will increase ROE, and that’s usually a good thing for equity investors. However, ROE can also be juiced by taking on debt and increasing the financial leverage.
Getting more out of ROE
Sometimes, three steps are not enough. The DuPont formula can be extended to five steps to gain an even more granular insight into the drivers of ROE:

This shows that ROE is equal to the operating margin multiplied by asset turns, minus an approximation for the cost of borrowing, and that is all multiplied by the financial leverage and then one minus the tax rate.
There is an assumption here that the only difference between EBIT and profit before tax is interest expense where there might be interest received and other non-operating income and expense items.
As an example of the five step formula in action lets look at Games Workshop (LSE: GAW) over the last five full financial years.
Games Workshop stock ROE breakdown
Games Workshop’s ROE has average a very impressive 59.9 % over the last five years. But there is a suggestion that it might be in decline. We can use the five step ROE to investigate further.

Games Workshops operating margin has improved from 34% to 38% over the last five years. That’s been good for ROE. The cost to borrow approximation is insignificant, which is good for equity holders. The equity multiplier has been largely steady, as has the term one minus the tax rate, which inversely measures the tax burden.
However, the asset turnover has declined significantly, offsetting the improvement and then some in the operating margin. The company looks to be becoming less efficient at using its assets to generate sales.
That is something that an investor will need to look into further, and I think demonstrates the power of decomposing a measure like ROE.
Appendix: deriving the five point DuPont formula
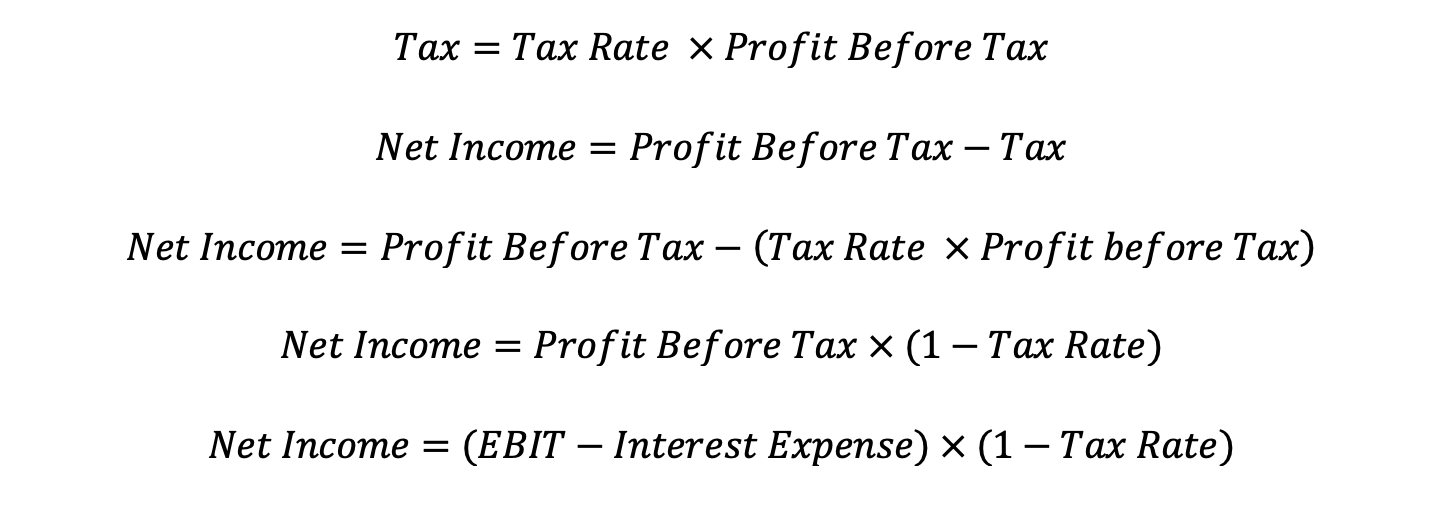
The first step is to express net income in terms of EBIT, interest expense and the tax rate:
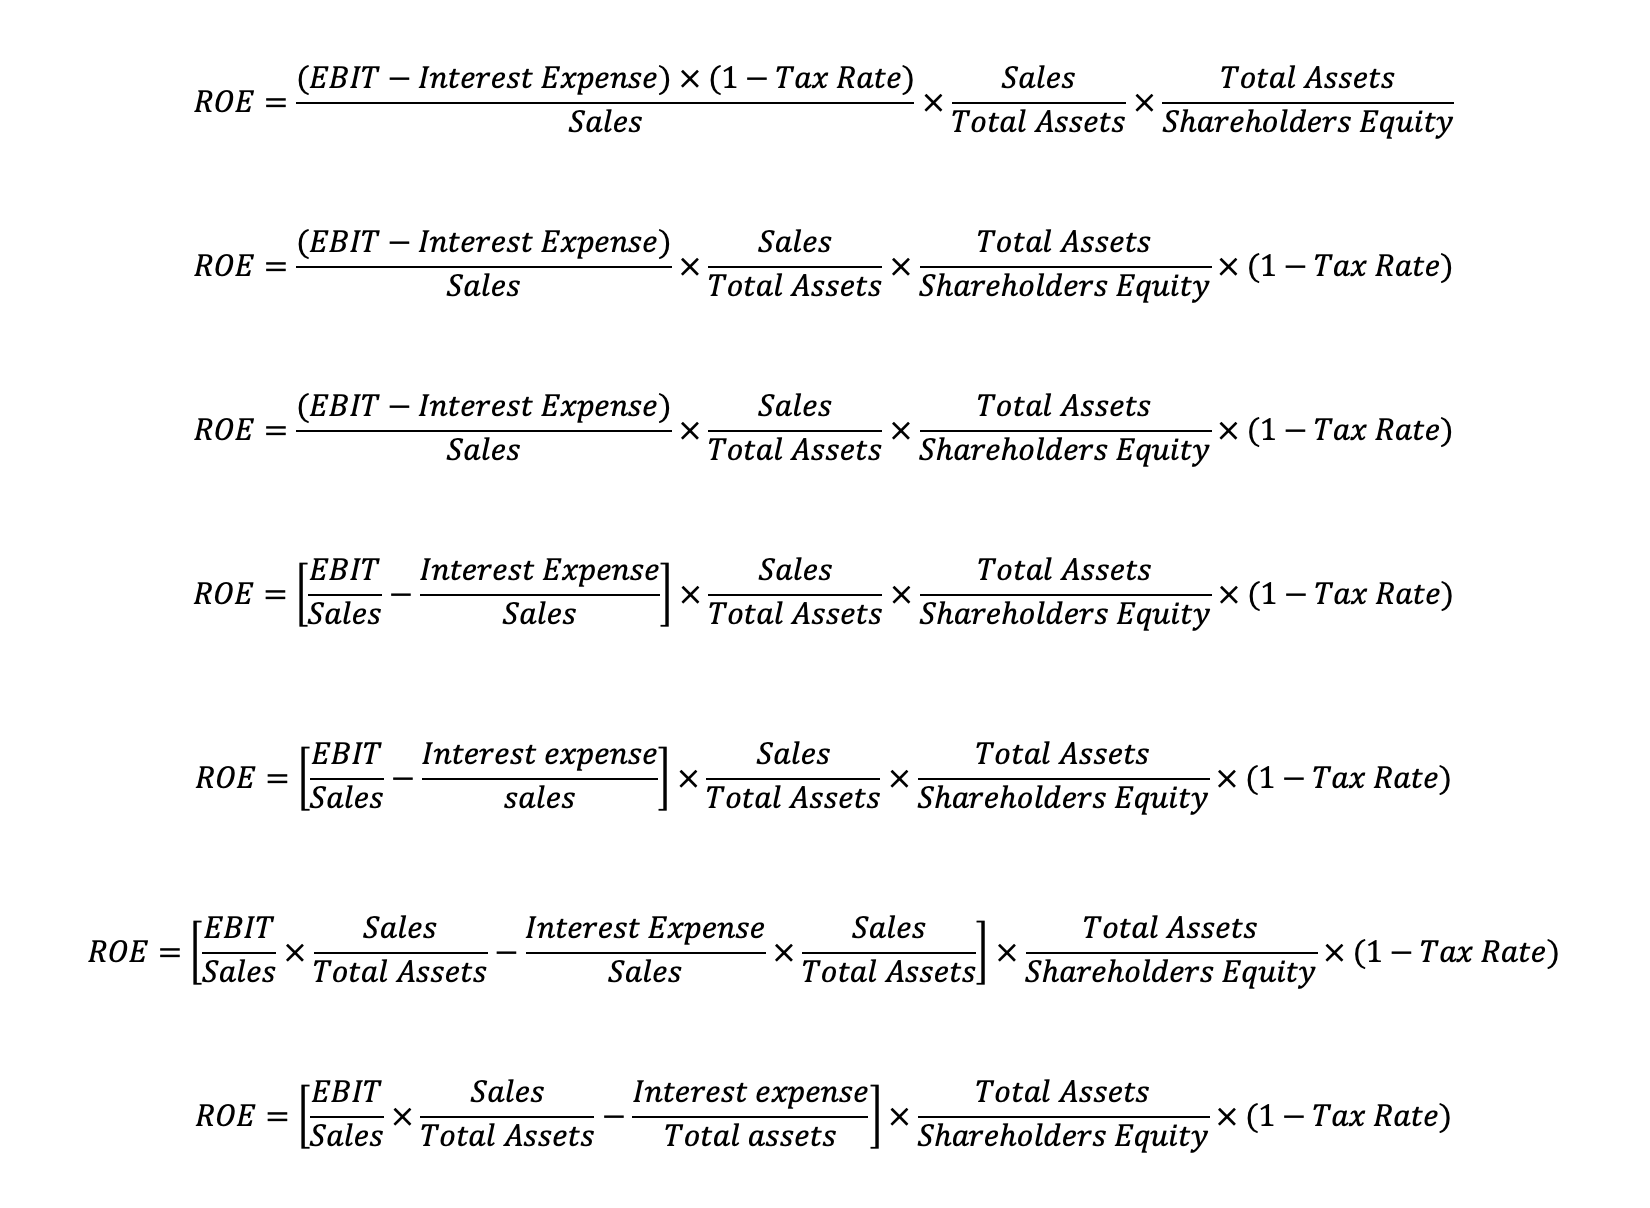
Now we can start with the three step DuPont analysis formula,

and substitute (EBIT – Interest Expense) x (1-Tax rate) for Net Income, and rearrange to arrive at the five step DuPont formula for ROE:
DISCLAIMER: James J. McCombie does not own any of the shares mentioned. The Storied Investor has no beneficial ownership position in any of the stocks or securities mentioned. No comment in this article should be construed as a recommendation of, or opinion regarding the future performance of, any stock or security or collection of them mentioned herein. Opinions expressed are the author’s and do not represent the views of The Storied Investor.
