
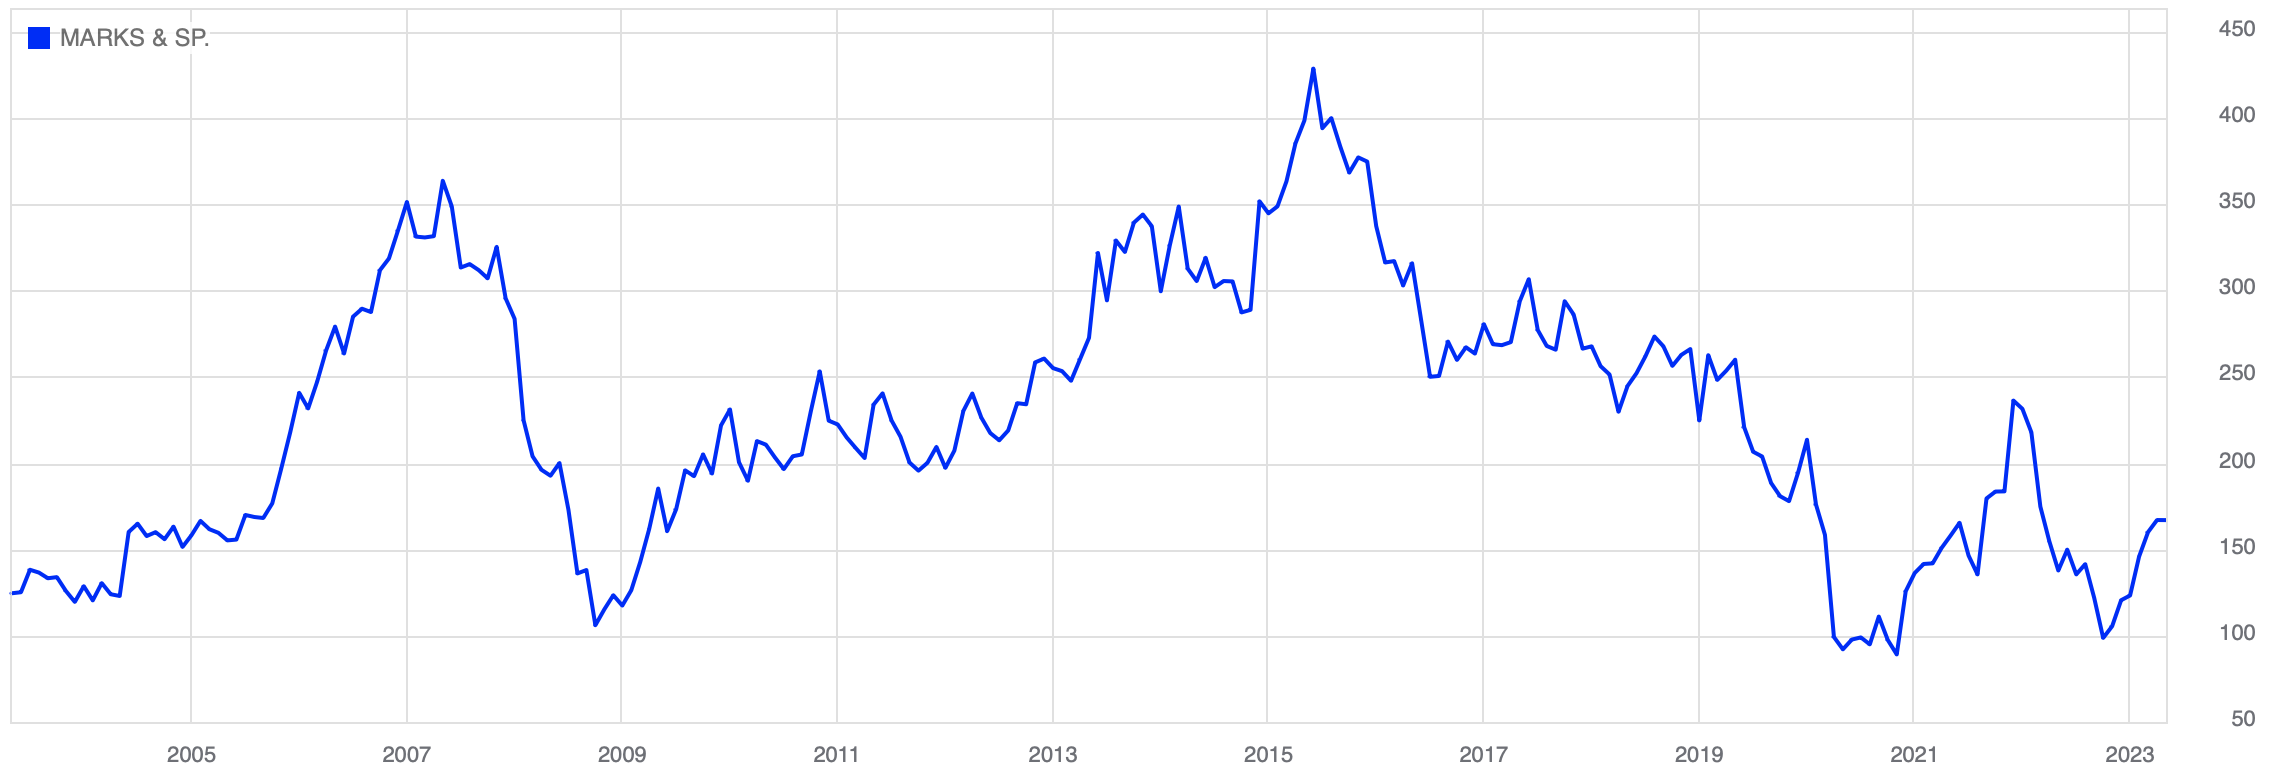
Marks and Spencer (LSE: MKS) shares were briefly priced at 707p in May 2007. Precisely 13 years later they were changing hands for 85p a piece. That is quite a decline. But, after putting in a multi-decade low, the price has been going in the right direction. Today MKS shares are worth about 165p.
And there is cause for optimism. The company had been in the doldrums. Management admitted that when it started to restructure in 2017. Then COVID-19 hit just when things were, according to them, starting to turn around. But now the mood in the boardroom is brighter. And the stock market commentators are taking note. Some are even speculating if the MKS share price will climb to 2007 prices again.

A run back to 707p would be a +300% gain. Not too bad at all. But, I would imagine that investors today would only be willing to pay 2007 prices for a stock if the underlying asset is the same.
Marks and Spencer in 2007
MKS published its annual report for the year ended 31 March, 2007 in July of that year. It reported revenues of £8,588m and £660m in profits with diluted earnings per share coming in at 38.5p. The 123 year old company employed 75,000 people, 520 UK stores (205 simply food including franchise stores in forecourts etc) 219 international franchise stores plus 21 wholly owned ones.
The company made just 1.2% of its sales online. It had just started to build a multi-channel offering. A new website (built under the guidance of Amazon) had just been rolled out. As part of its Plan A strategy, 90% of its packaging came from recycled materials and was itself recyclable. But if it was ahead of the times for sustainability, it was with them in other regards, like still pushing a phone and catalogue ordering service. Yet, the world was a different place back then. Bear Sterns had not yet collapsed, and the consumer had not yet suffered en masse the ravages of the Great Financial Crisis, which was starting to unfold.
So, with that albeit brief summary of MKS’s position in 2007, it is time to make the comparison now. I think two points of comparison are in order: one in 2020 before the pandemic, and one after in 2022.

Revenues increased from £8,588m in 2007 to £10,182m 2020 and again to £10,885 in 2022. UK Inflation averaged 2.49% from 1998-2021. So, inflation alone could have been expected to inflate 2007 revenues to £11,824m and £12,420m respectively. And it looks like total assets have roughly doubled from 2007 to 2020 and 2022, yet revenues have not grown commensurately—more on that later.
Retail margins
Moving on from absolute comparisons to relative ones, and MKS, on the whole looked better in the 2000’s compared to the 2020’s. Gross, operating, cash flow and net income margins are significantly lower now than in 2007. However, there has been improvement in all margins expect gross from 2020 to 2022. That’s probably input inflation creeping in between 2020 and 2021.

Leverage looks fairly stable between 2007 and 2022, suggesting that equity raises have taken place, since total assets have increased. Asset turns are a lot worse now. As noted, total assets doubled over the years, and revenues did not climb in tandem. But I do realise that there is problem with comparing accounts across time with companies like MKS.
Back in 2007 MKS leased lot of store space as it does today. But, in 2007, under IFRS accounting rules, it was able to classify leases as operating ones and leave them off-balance sheet. New accounting rules required them to be brought onto the balance sheet with a liability representing the obligation to make lease payments and an asset representing the right to use whatever was leased. This change, will have increased total assets. If an analyst went back and adjusted 2007 assets, I would wager the asset turn’s would look more in line. Now, I could do that. But, I think there are better ways of making the comparison which I will get to.
But revenue and profit growth are higher in 2022 compare to 2007, and especially to 2020. Perhaps then management was right when it said that it was starting to turn things around.
Stores, staffing and customers
Part of the executives plan for turning M&S around is closing unprofitable stores and laying off staff. In 2007 the company employed 75,871 people and had 760 stores (some of those are and remain franchises). After some trimming the numbers were 75,505 and 1,521, and after more 66,210 and 1,487 in 2022. It’s not just total numbers that have leaned out.
MKS Stores have gotten smaller. Average square feet per store was 20,518 in 2007 and it’s 14,593 now. That reflects the mix of M&S Simply Food stores and full-line high street stores tilting in favour of the former. Employees per store have fallen from 100 in 2007 to 50 in 2020 and 45 in 2022.
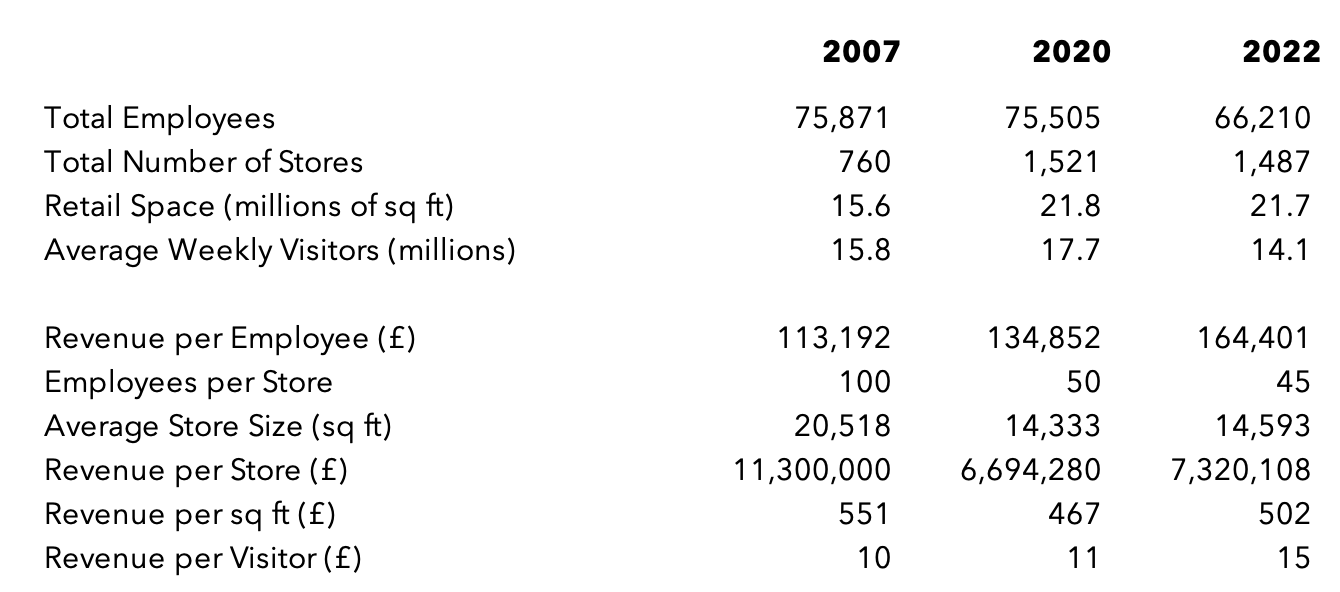
Revenue per employee has increased from 2007 to 2022 by 45%. Revenue per visitor has gone up by 42%. But revenue per store and revenue per square foot has decreased by 35% and 95 respectively. Finally, customers spend around £15 on average on a visit to MKS stores in 2022 compared to £10 in 2007, which is moderately above the inflation inflated value of £14.
Marks and Spencer share price
At the start of this article I set out to answer the question of whether the MKS share price can get back to 2007 levels. I said that would depend on MKS now being comparable to MKS then. But more than that, it will depend on retail stocks being thought of in the same regard now as then.
The average price-to-earnings (P/E) ratio for MKS’s diversified retailer peers is 12.6 now. MKS shares were trading at 16 times earnings back in 2007. The gloom and doom around the retail sector as a whole has to lift for that 700p push I reckon.
The demise of the high street has long been forecasted. Sure, sales have shifted online in a big way. However, people it seems still like to shop in person. Stores also offer opportunities as distribution hubs and click and collect points, as well as offering the chance for add on sales when the visit is made. I think that’s particularly true for M&S as clothes can be picked when popping in for some food in full-line stores. I personally, see some room for multiple expansion across retail. So, that’s one point in favour of the MKS share price getting back to 2007 levels.
But the company is not the asset it once was. Its profitability is miles off where it was. Can it recover that? Potentially. I think there is scope to boost online sales dramatically. It could get its clothes and homeward business towards the 18% operating margins that Next enjoys for example if it does this. But although its food business has better margins than competitors they are in the 3-4% range, and MKS gets about 65% of its revenues selling food. It seems to be leaning into this with more Simply Food stores and the tie up with Ocado to get its food an online presence. This will cap the group margins. And if investors see MKS as more of a supermarket then they will treat it like one: diversified retailers tend to have higher multiples than supermarkets.
I am leaning towards saying that the MKS share price hitting 2007 levels, like 700p, is a bit of a stretch. But, management does appear to be completing something of a turnaround. So, how about this, I feel able to say that I am cautiously optimistic the MKS share price to be higher in 2027 than now.
Marks and Spencer share dividend
Before I sign off, I wanted to say that price return is not everything. Talking about share price movement as being equivalent with investor returns seems to be the norm. However, total return is a better measure. In the case of Marks and Spencer, getting back to paying a solid, manageable dividend would be something. Looking back to the price chart shown earlier, and perhaps recalling some of the negative headlines it generated as it fell from the 2007 high, would make someone think investors had suffered for over a decade.
But a total return chart which includes dividends, tells a different story. Yes, there was pain to be had during the Great Recession, but from 2004 to early 2015 the total return was positive. This is a very different story than that gained by looking at the price chart.
Both price return and total return tell disappointing tales by 2020, although again total return looks a little better. And there is the question of whether MKS management should have been maintaining such a high payout ratio when profits were declining whilst saying it was running the company as a going concern. But, the point remains, total return better captures what portfolio returns investors get. Price return gets all the headlines.
DISCLAIMER: James J. McCombie does not own shares in Amazon, Marks and Spencer or Next. The Storied Investor does not have any beneficial positions in any of the companies mentioned.
