
The Santa Claus Rally was first recorded by Yale Hirsch, an analyst and author of the Stock Trader’s Almanac, in 1972. It is a calendar effect and was identified as a rise in stock prices in the last 5 trading days in December and the first couple in January. The ‘official’ Santa Rally does not start until late December. But, that does not stop headlines from being printed that attribute any market rise seen in the run-up to Christmas as the work of Santa. Much of this commentary, and indeed the initial work, concerns the US markets. However, unless the UK has been particularly naughty, perhaps Santa also gives FTSE 100 investors a present.
Has the FTSE 100 been naughty or nice?
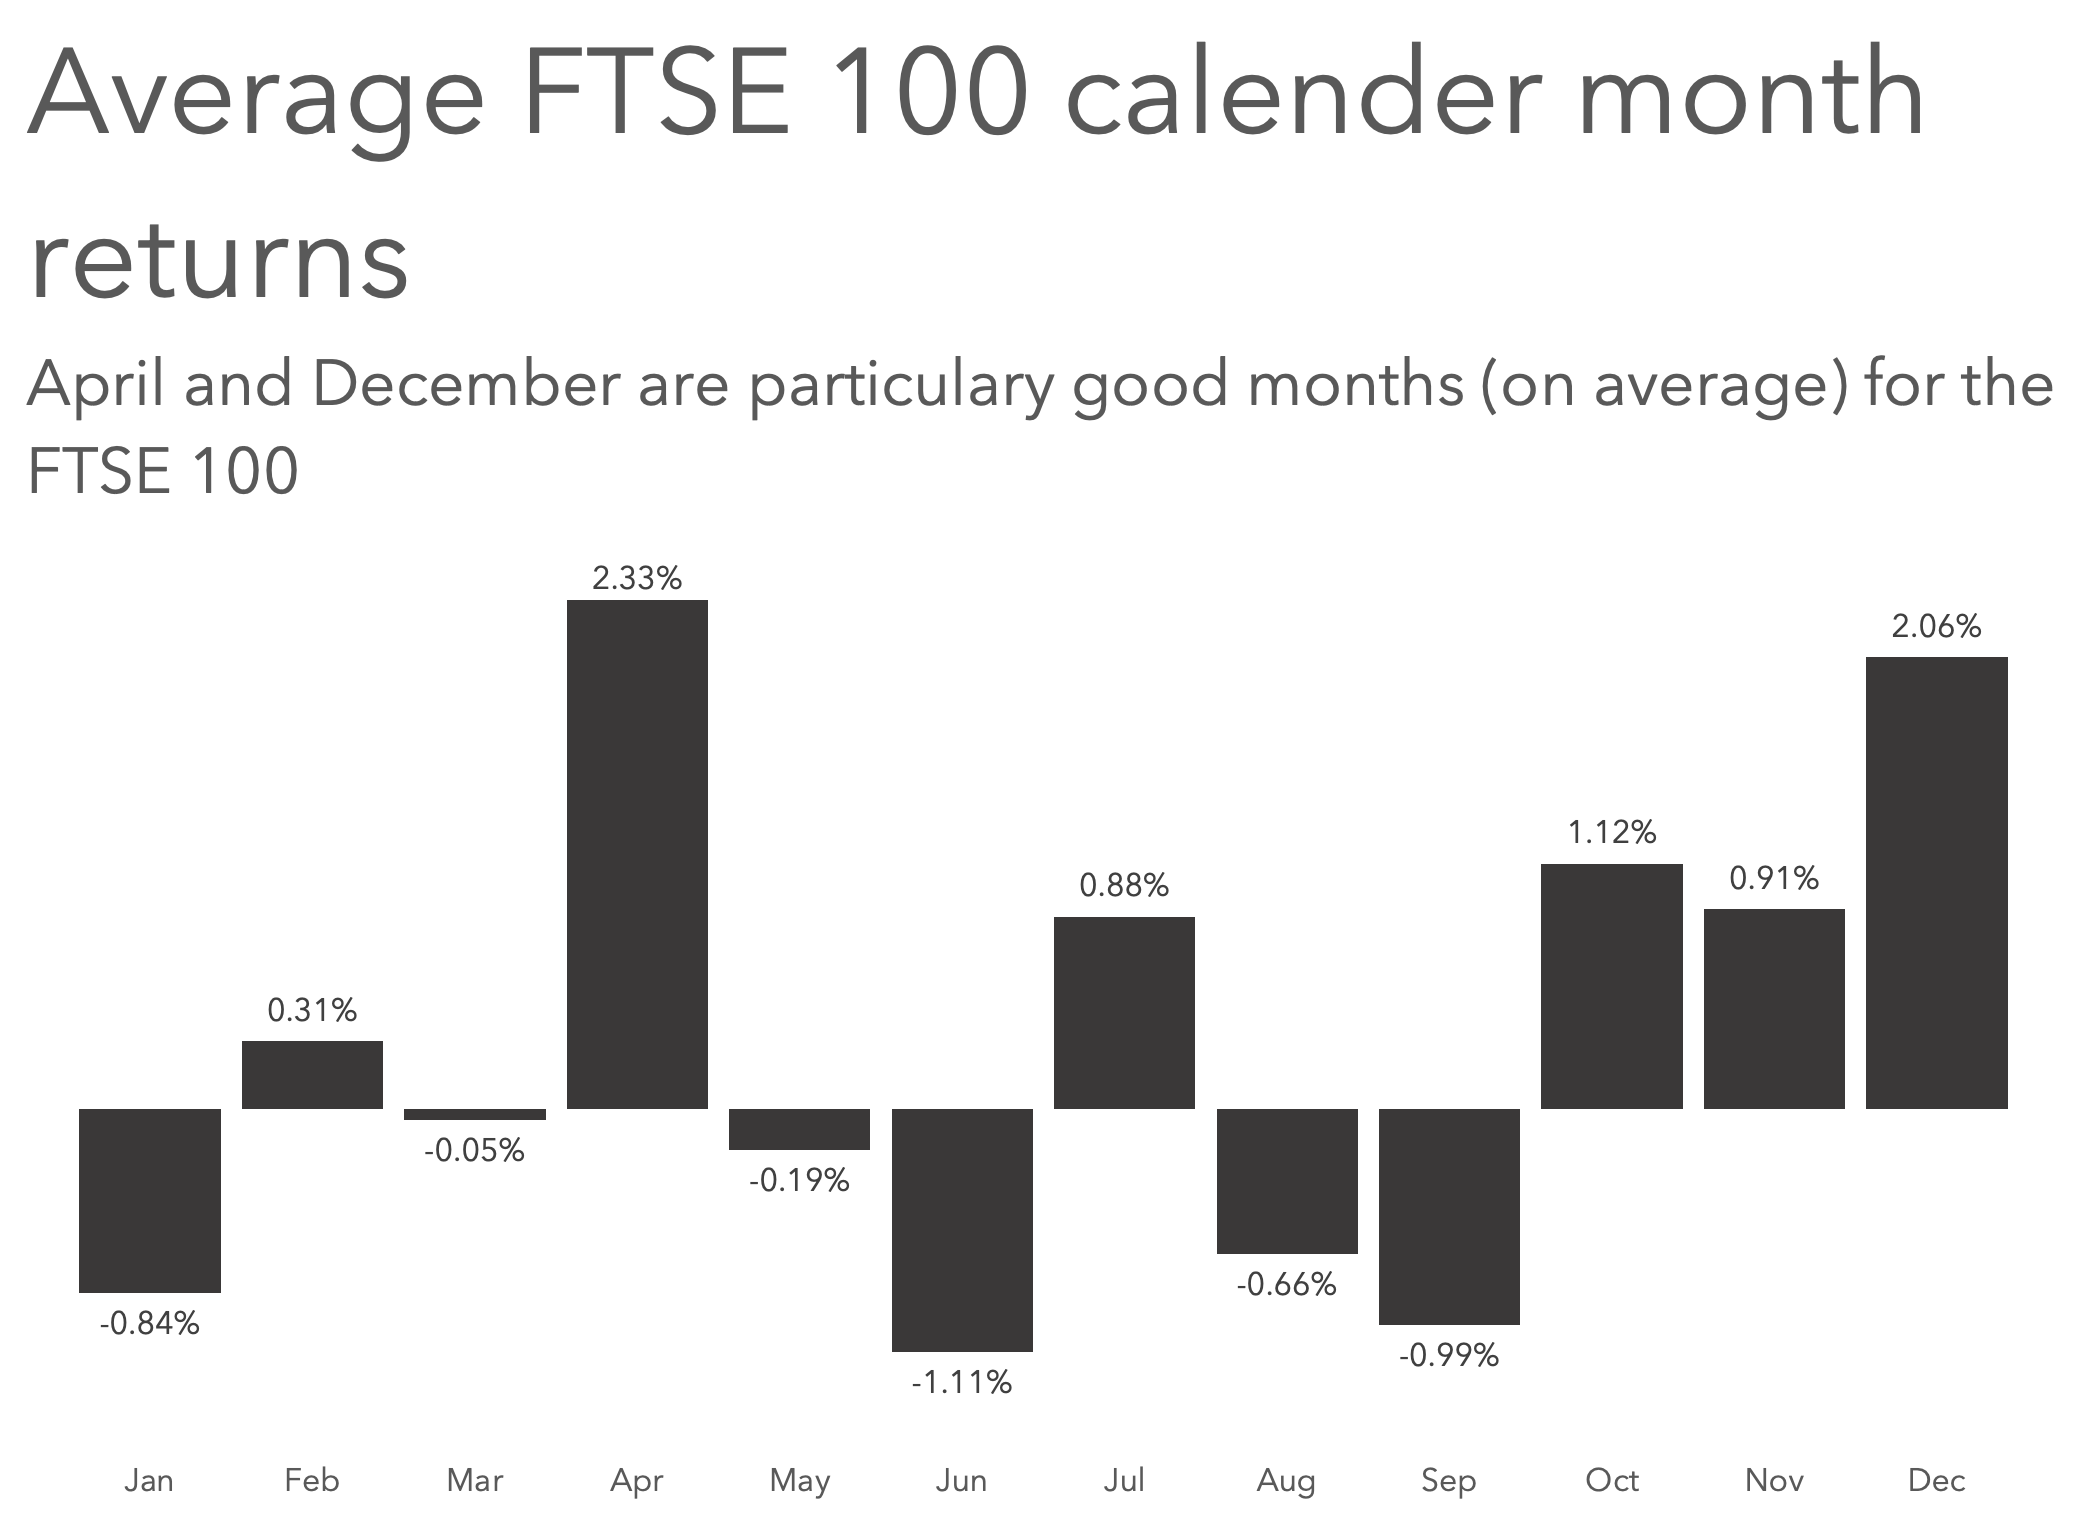
Using data from Yahoo Finance, I have calculated the calendar monthly returns on the FTSE 100 from 1996 to 2020. The returns are price returns, the change in the index number, these do not make dividend payments or reinvestment into account. A total return study, which does take dividends into account, will yield different results.
The mean average calendar month return is 0.28%. Six months have higher average returns, six have lower average returns, and December is amongst the former. In fact, December’s average return of 2.06% is the highest of any month except April, for which the average is 2.33%.
The standard deviation of December returns is the lowest of all the months at 2.94% (April’s is 3.33% for reference). If we look at median rather than mean averages, December comes out on top with a median of 2.67%, followed by April with 2.37%. So, December has the second highest mean average return, the highest median, and the lowest volatility of return distribution about its mean.
Is there really a FTSE 100 Santa rally?
On the measures seen so far, December does appear to be a month where the FTSE 100 performs particularly strongly. However, if the FTSE 100 return from January to November is positive, then the subsequent December return also tends to be, and vice versa. A scatterplot of January to November FTSE 100 returns for each year since 1996 on the x-axis plotted against the December return for the same year demonstrates this relationship.

Running a regression with the January to November returns as the independent and December return as the dependant variable yields some interesting results. There is weak correlation between the December return and the prior years return: the correlation coefficient is 0.44. Although the R square value indicates the Jan to Nov FTSE 100 performance explains only 19.78% of the variation in December returns, the overall model is significant (p-value for F statistic 0.02282), as are the coefficients (intercept p-value 0.00148, beta-1 p-value 0.02282).
So, December does appear to be a particulary good for for the FTSE 100, but the prior years performance does have influence on just how good December tends to be. That’s what we would expect intuitively isn’t it. A good year is usually capped off with a good month. Interestingly, December returns are not even weakly correlated with next years returns, implying there is a watershed moment at the end of the year.
The FTSE 100 return in December
So, is the FTSE 100 Santa Rally fact or fiction? It’s more real than I would have guessed. That’s probably as far as I would go. There is evidence that December is a particularly good month (on average) for the FTSE 100, but the same appears true for April (perhaps the easter bunny likes UK large-cap stocks?). But then again, It does appear that if the year has been good for FTSE 100 returns then December tends to also be positive. So, the Santa Rally showing up does appear to be, at least in part, conditional on the index performance up to December.
Are other months particularly good or bad for the FTSE 100?
It is always wise to be wary of historical patterns holding in the future. However, looking at the averages for the FTSE 100 calendar months, it may be thought that going long in February, April, July, and October through to December, and short at all other times would be a strategy that beats the index.
It is prudent also to be mindful that summary statistics like averages mask variability. The heatmap below does not attempt to hide the variability in the data. December and April do appear to pass the eye-test for being particularly positive months for the FTSE 100: there is a lot less red (negative returns) in their ledgers. The worst month on average, June does appear to have been a particularly troublesome month over the years.
FTSE 100 monthly returns from January 1996 to November 2022

The heatmap also serves to illustrate just what an extraordinary year 2020 was. The largest one month decline in the FTSE 100 since 1996 was recorded in March 2020. The largest monthly rise in the FTSE 100 since 1996 occurred in November 2020. The next most remarkable year was 2008, which was the year the great financial crisis kicked off in earnest.
