
Volatile stock markets: some people love them, many hate them, and all investors have to deal with them, eventually. The markets have been volatile this year. The swings have been wild. One day prices are up; the next down. But just how volatile have they been? In particular, how volatile have the UK stock markets been? We will look at the FTSE All-Share, the UK’s broad market index, to answer that question.
The FTSE All-Share combines the FTSE 100, FTSE 250 and FTSE Small-Cap Indices. It has about 591 constituents, with a combined market capitalisation of £2,137bn, which is between Canada’s and France’s nominal GDP. The median market cap is £625m. The largest company in the index has a market capitalisation of £164bn and the smallest one, £10m.
First, let’s look at the closing price history of the FTSE All-Share. The index has moved higher over the last ten years. This price index does not include the effects of dividends. Including dividends—a total return series—would not give an accurate picture of the volatility discussed daily. Anyways, the FTSE All-Share sits around 3,900 points today. A decade ago, it was about 3,000.
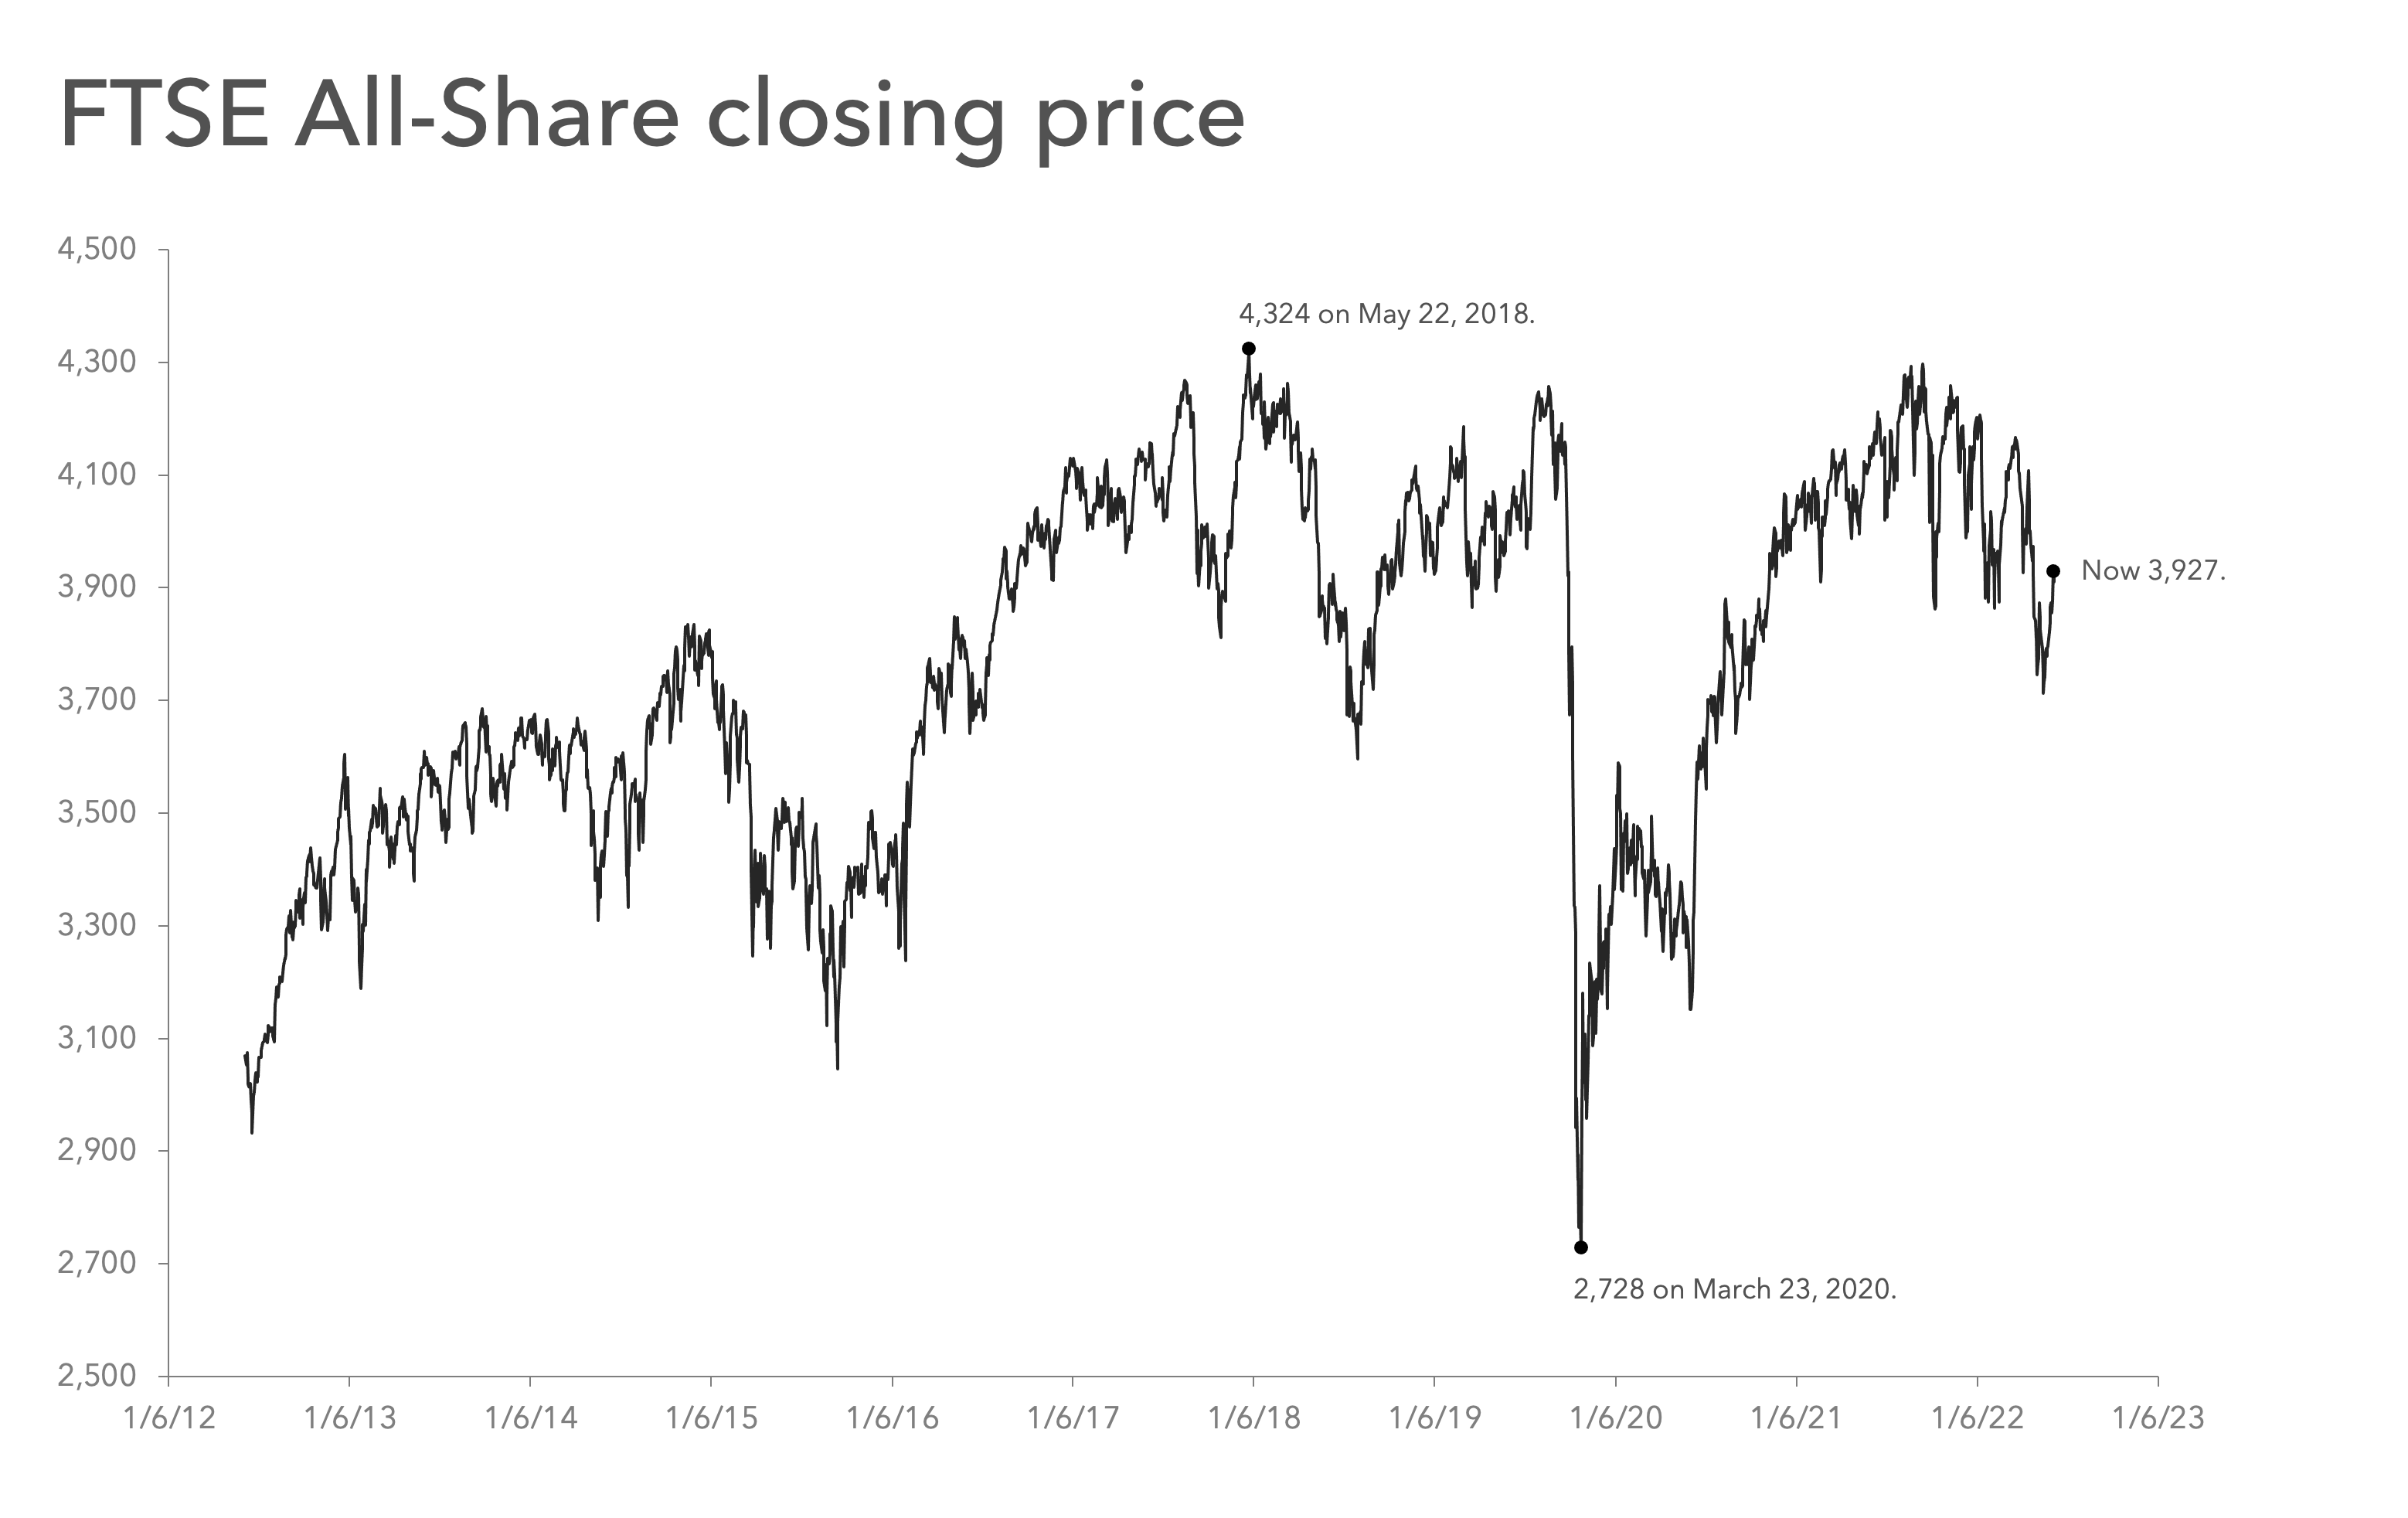
Looking at a chart of the FTSE All-Share’s price, there have been several notable pullbacks over the last decades. One occurred between mid-2015 and mid-2016. The next happened just after a high in mid-2018. Definitions of what constitutes a market crash vary, but to me, there has been only one stock market crash over the last decade. I am, of course, talking about the coronavirus market crash in February and March 2020. That crash took the FTSE All-Share from around 4,100 points to 2,728, a 30% odd decline in weeks. We are amid another pullback right now, which began in February. Concerns about global inflation and low growth were a cause but what really kicked it off was Russia’s invasion of Ukraine.
So, how volatile have the markets been? I used a daily return series to calculate rolling 21-day annualised volatility. The median reading over the last ten years is 11.6%. Volatility is below the median now, with a reading of 10.5%. It was as high as 30.3% in February when Russia invaded Ukraine and has spent most of the year above the median.

This year’s FTSE All-Share volatility pales compared to the 69.8% seen during the coronavirus crash. And the index has seen similar levels of volatility around the run-up to and around the Brexit referendum in June 2016.
One thing to note from the price history and corresponding volatility measure is that volatility increases during pullbacks and crashes. Overall, the FTSE All-Share index has shown above-average volatility for large parts of this year. However, it is not unprecedented volatility and has been trending downwards since February.
